Friday, June 27, 2014

Quick Intraday Update

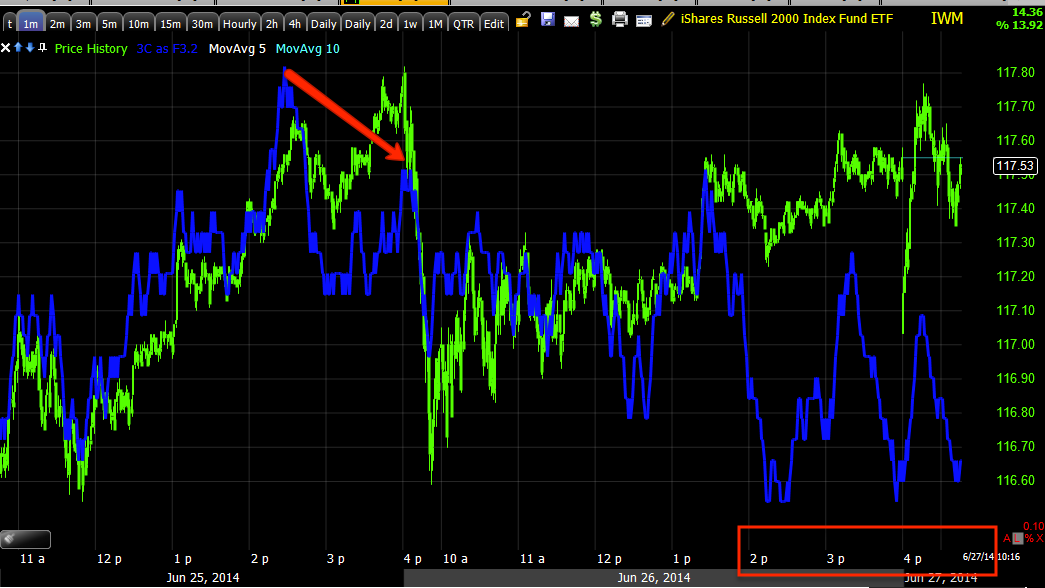
I'll get some charts up, but SPY, IWM, DIA as well as their Index futures are all negative intraday and adding to their negative divegrences.

The Q's have been in line on the 1 min chart for the last 2-days, this is the first time they have even started to turn negative so I suspect they'll all be coming down shortly. I'll get charts up, I'm considering a quick fade trade for a downside move, but I'll let you know for sure if I do make that move beforehand as always.

Charts coming.

Trade Idea/Set-Up: (Longer Term) PCLN

This is one that I've been interested in for a while and surprisingly, this is one that I get a huge amount of emails about and most are about shorting it, it seems there are a lot of people who don't care for PCLN or perhaps have an axe to grind, just be careful that you are not revenge trading or entering a position because you lost money there and you want to get it back there, that's just ego. If you want to make money back, find the best opportunity, it doesn't matter if it's the stock you lost it in, but so many times (we often don't even realize we are doing it), we try to make money back in the same asset we lost it in, that has to do with not wanting to be wrong, beating the stock in the end and being right. This is one of the reasons there's a Wall Street maxim/question that asks, "Do you want to be right or do you want to make money?" The question sounds contradictory until you look at it in the light of a scenario like revenge trading as described above. The fact it's such a well known saying in the markets just goes to show how pervasive the effect is.

Charts...
 Here's PCLN over a 2 year period, we have a stage 1 base, stage 2 mark-up (this is where the easy money is made, stage 4 decline which I believe we are very close to, if not already in when looking at averages like the Russell 2000, is actually an easier area to make money a lot faster as fear is stronger than greed and markets fall much faster than they climb. Both stage 2 and stage 4 are trending stages while 1 and 3 are lateral base and top stages) and stage 3 top. a H&S top MUST come after a preceding uptrend, typically the longer the better.

Also note the volume rising in the area of the H&S top, and recall how many of these price patterns are out there right now and all right at the top of the right shoulder much like the Russell 2000 which is the average that is considered the market leader.

 I know this is sloppy and hard to read, it's a custom indicator I throw together that cumulates olume so you can more easily see the volume trends at the price trends. It's exceptionally important to verify a H&S top with volume analysis, the entire price pattern is formed because of psychology and volume is a big part of the psychology.

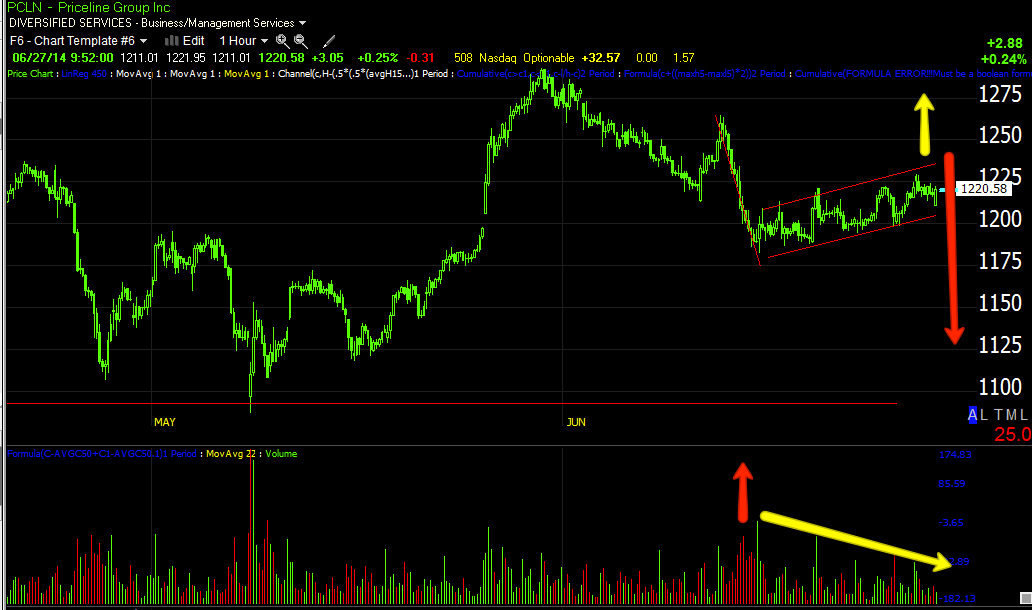
We should see falling volume on the rallies in the H&S top and rising volume on the declines, just follow the white line and price, I added red arrows to show falling volume on rallies and used yellow arrows for  rising volume on declines. The left side of the pattern isn't as important, but by the time you reach the decline from the head (right side of the head), volume becomes increasingly more important to confirming the price pattern, note volume to the far right on this last little bump up, also a bear flag like the market.

 This is the daily 3C chart showing the correct underlying trade/distribution that increases as we move further to the right of the pattern.

For a longer term view, here's a 4-day 3C chart.

 At 2009, 1  we have strong confirmation and a leading divergence, the gain for the year was 192%. At 2  we see some light 3C weakness during 2010, the gain for the year was 81%. At 3  we see a relative (weaker form) negative divegrence and price starts to stagnate, the gain for 2011 was only 14% and the gain for 2012 was 28%.  At 4  we see a change in character in the Rate of change in price, remember the concept that changes in character lead to changes in trends, at the same time we start to see a leading negative divegrence. Think about what smart money with multi-billion dollar positions needs to exit those positions without flooding the market with supply and crashing price and thus their portfolios...they need demand and what better way to get it than to create a strong momentum push that retail will follow and buy whatever they can. The gain for 2013 was 79%, a huge change in character from 14 and 28% the two preceding years. And as we reach the leading negative divegrence at 5, which is where the H&S top is, the gain for the year for 2014 thus far is 6.79%, as I said, the change in character/ROC of price in 2013 led to a major change in trend at 2014, the lowest return thus far by a wide margin.

 This is the 4 hour chart, 3C is acting as it should, much like volume acts during a H&S top. To the far right at the yellow arrow is a small bear flag similar to what we see in the market right now.

 The hourly chart is showing confirmation right up to the H&S top, then a leading negative divegrence of large size.

 The 15 min chart at the top of the right shoulder and the small accumulation that created the rally right now that is a bear flag. I don't see a strong negative divegrence in the flag on this chart yet which is something I might want to wait for, depending on how I trade, how much patience I have, how much risk tolerance I have. One compromise is to phase in to the position in 3rds or half size positions, adding the last part of the position as we have either higher prices with very good signals throughout all timeframes or simply very good signals throughout all timeframes.

When a market falls, it typically doesn't give much warning and judging by everything I've seen, especially since the last F_O_M_C last week, this market feels very dangerous, thus I increased my short coverage yesterday with SRTY (long).

 The 5 min chart is smaller underlying flows, it shows the accumulation that started the flag with much more detail, it also shows a current negative divegrence building, I'll be looking for this to intensify and hopefully migrate out to the 15 min chart.

The 3 min chart shows even more detail and the negative divergence on the 5 min chart above  over the last 3+ days is seen very clear here as it has migrated to the 5 min chart, suggesting it is gaining strength,

However, this is still a bear flag, a very common technical price pattern that is expected to break to the downside first which is why we see them head faked with upside breakouts more often than not as Technical Analysis teaches, "If a price pattern doesn't move as it should, it's a failed pattern and you should reverse your position". In the Wall St. world of misdirection, that would mean any bearish PCLN traders looking at the bear flag and then seeing a head fake breakout to the upside, would or "should" according to technical analysis, go long, this creates a bull trap and when prices resume down and come to the flag area where the long positions will likely have their stops, the move below sets off a cascade of stops being hit, adding supply to the market and driving prices lower. This is one of the main functions of a head fake move, to generate momentum without actually investing any money in to it.

Looking at the daily chart/big picture, this bear flag is almost a matter of semantics, I'd much rather not miss the move waiting for a head fake of a couple of percent, but at the same time we always want to get the best positioning, the lowest risk and this is a concept we are well acquainted with, making it a probability.

I'll be setting some alerts for price action both above the upper resistance trendline of the flag as that would be the best entry or add-to area and a set of alerts below the support of the bear flag in case it just breaks, I'd rather be in below the flag, but above the H&S neckline that not be in at all. If you are interested in the trade set up, I'd suggest setting some similar alerts.


Opening Indications

This morning's open with a quick retrace of overnight losses is actually not all that difficult to understand, I think one of the things that is most difficult for traders to comprehend about the market is that it's not a fair game, it's not a rational game, it's a rigged game. When you look at the market from the point of view of a hustler or a criminal who has all of the advantages, it becomes much easier to understand, you can throw out all of those Technical Analysis books because even if they can correctly identify price action that can forecast future movements, they don't understand the psychology of the market. Of a hundred-plus stock market books I've read, I haven't seen one, except maybe "Trader's Manifesto" by Don Worden, that even come close to addressing what really moves markets, instead they focus on whatever new technical trading system they are trying to push so you buy the book. By the way, I've used StockFinder's backscanner to test every trading system I can remember as I would prefer "system's trading" and take myself and my emotions out of the equation, but every single one pushed in these books failed over a full market cycle (they may have performed well in one environment, but then utterly failed in the next). In fact, the only automated trading system I found (actually created) is one that only trades 1 -2 times a year, it has spectacular results, but huge drawdown periods and the bottom line is no one has the emotional fortitude to go through that without stepping in and thus ruining the system. I'm not talking about "beating the market", that can be done, my trading portfolio opened in March to test the waters for funding my accounts (make sure I can do both without sacrificing anything to either the website or my account) is beating the market easily. What I'm talking about is "Systems Trading" ability to beat the market, it's not there which simply means you have to think for yourself, you have to do the work, there's no easy way by following moving averages or indicators alone which is what I think the attraction to Technical Analysis is all about, laziness.

In any case, with this morning's quick gap fill, think about it from a simple emotional standpoint, you wake up, see futures in the red fairly deeply after Bullard's comments yesterday, most people don't have any idea that Japan and the USD/JPY was a big part of causing the futures to fall, they just see fear and we all paint pictures of "What's going to happen next", for instance when the market opens and those pictures we paint in our minds are scarier than anything anyone can tell us so it's not uncommon for traders to get scared and unload positions in pre-market, fearing a collapse in the market on the open. Someone has to absorb those shares, it's not likely to be other fearful retail traders, so if you are a pro, picking up shares on the cheap, it's a gift, what are you going to do with it to start your day?
ES/SPX futures shows pre-market dumping of shares and someone is accumulating those on the cheap, on the open where there's some real liquidity, they run the market up and cash in for a nice trade in the morning to start the day. You have to get away from looking at the market as moving averages and indicators and look at it as emotion and how the criminal element (pros) capitalize on that, then the market's true nature becomes much easier to understand, predict and follow.

As far as the Flag-like price pattern of the last 2-days, it hasn't given us much to understand it with other than the fact it looks like Wall St. set up a small cycle that was meant to be a bear flag and Bullard's comments about the "Market being wrong, the F_E_D is a lot closer to tightening due to inflation" distorted that flag in my view. However we are getting some indications now, of course this is all short term stuff, the chart posted last night is probably the most important chart I can think of right now (when understood in the context of the post I put up a week ago, 10-Year Yield (Bemchmark) vs. the Market  and linked in last night's post, the implications are very simple and very reliable).

As for the flag...
 The SPY looks like 2 distinct flags, they would be bear flags because they consolidate against the preceding trend, I think Bullard's comments are what distorts these in to 2 individual flags rather than 1 larger one.

The Q's are a bit closer to what I think was intended, Bullard's comments are one of those things the market can't discount because it didn't know about it, that's when we get price deviating from Wall St.'s set-ups. Even volume gives the appearance of a flag.

As for the charts... there's clear deterioration setting in now.
 SPY 1 min on the open this morning going negative in to the attempted gap fill which would simply be the shares picked up in pre-market being sold at higher prices.

 However the longer term 2 min trend went from the very dull, in line (green arrow) to what is looking like increased distribution, still flags are tricky the more obvious they become as they are head faked often as traders expect a certain outcome from a bear flag ( a break to the downside).

 SPY 3 min is confirming the above as well, I'm not quite sold that this is the start of an imminent break to the downside, but it appears whoever got this flag rolling is taking the opportunity to let go of shares at higher prices or short in to them which would be what I'd want to do after Bullard's comments, you don't want the train leaving the station before you've had a chance to buy your ticket.


 QQQ intraday this a.m. showing the same thing as the SPY.

2 min showing the same weakness building in which was not easily seen the first day and a half or so, I suppose that's because there's no point in distributing in to prices that are not yet higher.

 QQQ 3 min with additional confirmation.

And QQQ 10 min with the highest probability outcome, despite any potential head fake moves on the flag-like pattern.

IWM 1 min, which looks worse than the others, I'm actually quite satisfied in picking up SRTY rather than SQQQ as initially planned; not that I don't like SQQQ, I just think SRTY has more immediate potential.

 IWM 2 min showing the start of the flag with some minor accumulation and negative divegrences as it reaches higher.

The 5 min chart is where I start to take it more seriously and we have a negative divergence there, it's not a screamer, but it is a lot better than the confirmation signals of the first and second day of the flag when there were few signals.

The 15 min chart shows the highest probability resolution of this price pattern of all the charts above, it also shows there's nothing even close to confirmation here so this wasn't a strong flag created and...
The 60 min chart is just moving down further and further, this is the bigger picture highest probability resolution of price.

I have some interesting charts for PCLN which is also in a flag, I'll get those out ASAP, it also happens to be a H&S top near the right shoulder.


A.M. Update

" I think the Bank of Japan may have pushed Central planning too far and may be seeing their QE policy blow up in their faces."
Sunday April 14th, 2013

Yesterday did have a very strange tone to it as the day before and we did have a dovish F_E_D president essentially tell the markets, "You are wrong, we are closer to hiking rates than you think". That may be the reason most US averages are down around -.10%, the Russell 2000 around -.40% (glad I grabbed SRTY yesterday), however the plunge in the USD/JPY from it's nest at $102 could be another reason.

The quote at the top is from some analysis I did when the Abe and the BOJ set off on what we could see at the time was not only QE-Zilla, but a disastrous idea in central planning.

Overnight in Japan, inflation data came in and it's up at the fastest rate since 1982 while real wages have dropped for 23 consecutive months, this apparently sending the USD/JPY significantly lower and the Nikkei as well. May CPI came in at the expected 3.7% y.o.y., but that's still the fastest rate of increase since 1991. Consumer prices in Japan are up at the fastest rate in 32 years and the consumer has pulled back to the levels of Fukushima.

So take your pick as to why US futures have been hit so hard this morning, one, the other, both, maybe even some other things that we are seeing signs of , but don't yet know about.

I do know whatever carry traders were left in USD/JPY, got hit very hard at the leverage they use on an at least 40 bps move lower overnight.

There are no significant divergences in US index futures at present so it looks like we'll be seeing red on the open.


Thursday, June 26, 2014

Daily Wrap

I'll keep it short tonight, but VERY on point with one of the most important charts of the last week, perhaps of the year, perhaps even longer.

I think the event of the day, perhaps even the event of the year (although contrasting it with last week's F_O_M_C and Yellen's press conference is difficult to reconcile), must be this morning's rebuke of the market by a normally "Dovish" James Bullard, the President of the Federal Reserve Bank of St. Louis.

Some bullet points from Bullard this morning...

  • BULLARD SAYS MARKETS DON'T APPRECIATE HOW CLOSE FED IS TO GOALS
  • BULLARD SAYS HE'S TRYING TO PUT EMPHASIS ON CLOSENESS TO GOALS
  • BULLARD: MARKETS SHOULD BE PRICING IN RATE INCREASES BASED ON WHAT THE FED SAYS
  •  BULLARD: ECONOMY SHOULD BE ABLE TO HANDLE IT IF WE BEGIN TO PULL BACK FROM WHERE MONETARY POLICY IS NOW

A President of a Federal Res. Bank who is known for leaning on the "Dovish / accommodative side", doesn't likely go out and flat out tell the market that it's wrong without the ok of higher ups and there's only one higher up and she's a she. One has to wonder why send out a dove to bring news like this? You'd normally expect this to come from one of the hawks, my guess is "credibility" as a moderate dove.

Bullard told Fox Business news, 


Fed Could Hike Rates in 1Q 2015

And guess why?

"Inflation is moving in the right direction toward the central bank’s 2% target, St. Louis Federal Reserve President James Bullard said Thursday, perhaps prompting an interest rate hike as early the first quarter of 2015.

When that happens, it will require a delicate balancing act by the central bank to keep inflation in check, using rising interest rates to keep prices stable, Bullard said in an exclusive interview with FOX Business Network's Maria Bartiromo on Opening Bell."

This is exactly what I have been saying, the one thing that would FORCE the F_E_D's hand, INFLATION which is not noise, it's a trend.

Earlier today I emphasized that although we want the best entries and exits and watching intraday trade often gives us that, we don't want to get lost in the lines, miss the forest for the trees and that's why I put up this post showing where we really are in predictive price patterns...The Bigger Picture

In that spirit, as we have seen the F_O_M_C knee jerk reaction come and go, there's only 1 chart I feel is VERY important to share with you tonight, that would be the following...
This is the SPX (red/green) vs. 10-year Yields (white) since the F_O_M_C. Remember how many times over the last week I said the rather benign policy statement seems to have kick-started fear with smart money? We've seen it every day whether moves in VIX, moves in 3C, relative strength in Defensive S&P sectors such as Utilities (see last night's EOD post), moves in inflationary hedge assets such as Gold and Silver.

If you look at the chart above showing the direction of 10 year yields since the F_O_M_C on the 18th, all you need to understand how significant this chart is and what it means to the market is this post from a week ago, 10-Year Yield (Bemchmark) vs. the Market. 

Look specifically at the charts comparing 2007, 2009, 2011 and right now and then take one more look at the trend in 10-year rates above since the F_O_M_C and CPI released just before, it should be resoundingly clear, especially in light of posts like today's The Bigger Picture.


SCTY Update , History and Market Dynamics as a Proxy

If you just want to see the current SCTY charts, skip down toward the bottom of the post, but I think there are some very interesting things we can take away from the recent history, our trades, posts, analysis, etc over the last month or so. In that case, this post serves in a way as a broad market update while also covering SCTY.

SCTY was first featured here as a "Momentum Stocks" hitch-hiking LONG trade on May 16th, Momentum Stocks. The other stocks featured and the resulting gains since the "Hitch-hiking" long trade of momentum stocks from May 16th include: FB +16%, AMZN +12.6%, PCLN +13.6% and SCTY +41%.

The chart provided for SCTY was the following with the following comments from May 16th (in red).
"SCTY I looked at pretty closely today and it too would be a candidate.

I'll likely go through my momo watchlist and pull some other names out that may be interesting,  however don't forget that these are for short duration, "Hitch-hiking" (meaning to follow the market or draft it) trades."

It turns out SCTY was bouncing from the neckline of what looks like a pretty well formed H&S top, to create the right shoulder; that's why the trade ideas all came with the caveat at the end of the post, "however don't forget that these are for short duration, "Hitch-hiking" (meaning to follow the market or draft it) trades."
Above you can see where the mid-May SCTY price level would be, right near the neckline of a H&S price pattern/top.

I doubt there's any coincidence that the broad we were expecting a break-out/head fake move above the SPX's 3-month range and the $1900 level where range resistance was right at the same time, mid May, in fact the bear flag we suspected would sling shot prices higher was formed May 15-20th which is when and where we are talking about hitchhiking longs as well as the bear flag that started forming was looking as it would be used to create a short squeeze.

This is from May 16th as the bear flag was just forming...
"Most Technical traders won't short a bear flag itself without the confirmation of a break below the flag's support (bottom trendline), however on the break below the flag they will chase price and enter a short position. If the larger head fake move is actually to the upside, catching some shorts in a bear trap and forcing them to cover as price moves back above the flag and forces a small squeeze just adds more upside momentum to the head fake move."

The point being simple, it's not coincidence that the momentum stocks were looking ready for an upside move as the market was setting up a short squeeze move based around the bear flag from the 15-20th of May, which was only about a week after we had said the probabilities of the market turning lower from the 3-month range in the SPX are very low without an upside head fake move first as the range is just too obvious in the most watched ETF in the world.

This move is what set up most of the right shoulders we are seeing now in the averages like the IWM and watchlist stocks including SCTY.

We had another SCTY "Momentum Stocks Update" on May 20th which was the lowest close in SCTY (also very close to its neckline) since then, essentially the best entry you'd get SCTY long, SCTY Update. (Excerpts below in red)...

I haven't forgotten about the momentum stocks watchlist that I talked about on Friday, it just hasn't been  a very interesting list since Friday....You may recall that one of the breadth indicators I use from Worden's T2 series, is the Percentage of NYSE stocks trading  2 Standard Deviations Above their 40-day moving average; these tend to be momentum stocks and besides just knowing generally that they have been beaten down lately, we can see it on this indicator as they went from over 40% to 30% to 10% in just a matter of months, in other words they were beaten down pretty badly and this makes sense from an asset manager's allocation p.o.v., they want to get out of the high beta names and in to the blue chip, dividend paying names if they are going to be long.

The last sentence underlined and in bold above is interesting given the same indicator was featured in last night's End of day Wrap, A True Dead Cat Bounce? Except this is post-bounce and it is now showing a different set of indications than mid-May, see charts and excerpts from last night's post below (again last night's post comments are in red).

"Furthermore in looking closely at breadth indicators, I found this which may speak to high beta stocks that the market has been chasing all year and then some."
 " Percentage of NYSE Stocks Trading Two-Standard Deviations Above their 40-day Moving Average."


"Percentage of NYSE Stocks Trading Two-Standard Deviations Above their 200-day Moving Average.

In both cases, this is only the second time since late 1013 to early 2014 that the indicator in green (vs the SPX in red) have failed to make a higher high, in both cases the SPX had its biggest loss of the year, about -6% over 8-days.


Hopefully tomorrow we'll have some more insightful signals. All of the averages ended with 1 and 2 min negative divergences at the end of the day."

The point being, that these breadth indicators above, after the mid-May expected bounce led by none other than momentum stocks, which also tend to be the "Most Shorted" and as you know, a large part of the move from mid-May until now was "Short Squeeze" induced. The failure of these "Momentum/Most Shorted Stocks" to make a higher high with the SPX is likely proof of exactly what was said in mid-May regarding momentum stocks rallying...

"in other words they were beaten down pretty badly and this makes sense from an asset manager's allocation p.o.v., they want to get out of the high beta names and in to the blue chip, dividend paying names if they are going to be long." May 20th SCTY Update...

The point again being large institutional and hedge finds often carry single positions of a billion dollars, for some funds that's considered a "moderate" position size. I have often compared institutional money to a large oil tanker that needs miles to come to a stop whereas we are jet skis, we can get in and out of a trade in a single day and not move the market against our position as long as we are trading something fairly liquid (not penny stocks), it's not the same for institutional money, they need to create demand to unload a billion dollars worth of stock, they need to do it in to both demand and higher prices and in smaller pieces over a longer period. This is the entire concept of a head fake move, to create demand that they can unload in to. Remember, we confirm head fake moves as a real move won't show distribution whereas a head fake move will. The question then is simple, what do you need to do to get retail buying and sell in to strength as we know that has been the trend...

You may be tired of seeing this chart, but it illustrates the point being made...

Institutional money and hedge funds to a lesser degree (orange and blue) are net sellers (which includes short selling as both come across the tape as a sale) while retail (green) have been huge buyers, who do you think is selling to who?

I digress, back to the question, what will cause retail to buy after being eaten alive in a 3% wide 3 month range in the SPX?

A breakout above resistance and the psychological whole number of SPX 1900, both in the exact same place, at the breakout level or top of the 3-month range.
While this is a MACRO example of the head fake concept which essentially states that reversals (in this case to the downside) see a head fake move at least 80% of the time and in every asset and every timeframe so the concept is fractal, which means it works as well on a daily chart like the one above as it does on a 15 min chart. The key is to confirm the head fake move...

Confirmation of a head fake move, a large one. See "Understanding the Head Fake Move" articles on the upper right side of the member's site.

The second point in last night's breadth indicators failing to make higher highs is what we were looking for before the move began as long only funds move from high beta to Defensive, for instance, Utilities which I also showed last night outperforming the market of the 9 S&P sectors.

Back to SCTY (the point however is that SCTY is a proxy for the general market).


From the SCTY update of May 20th... SCTY Update

"Here are the charts and why SCTY is starting to look timely and interesting."
 "The recent 3C charts at the bottom of the right shoulder are showing the kind of divergences you'd want to see for such a price pattern, here the 1 min trend is leading positive at a new high as the lower right shoulder is formed, perfect."

" The 3 min chart shows a positive at the lows of the head and an even stornger leading positive at the lows of the right shoulder, just as you'd expect to see."

"The highest probability trade would be to catch SCTY and the overall broad market both in positive divergences and looking ready to make a move, the market will give SCTY something to draft."

The SPY broke out about a week before SCTY.

Now after SCTY's major move, featured this week on Tuesday, June 24th  as a Short trade "Set-Up" Trade Idea/Set Up: (Longer Term) SCTY

"SCTY... This is actually, a larger H&S stage 3 top and guess where? Right at the top of a right shoulder, the dominant theme among the watchlist."
" Here's the daily chart with a large H&S top at the top of the right shoulder"

" As for the 15 min chart which went positive to form the right shoulder as price was sitting on the neckline, it is now leading negative and I suspect it will get a lot worse.

Note the head fake move hitting stops before the upside reversal"

As for the 15 min chart getting "worse", here it is a mere 2-days later...
The white trendline is where the 15 min 3C chart was this Tuesday so it has in fact gotten worse, which would suggest there's been more institutional selling in to any price strength available.

and...
The SCTY 5 min chart as of Tuesday vs...

The 5 min chart as of today, it's lower than Tuesday, but more importantly is the move of the last 2 days has seen a steeper leading negative divegrence (red arrow to the far right). The 5 min chart (and shorter timeframes) is typically a good chart for timing of entries.

"The Trend Channel has held the entire right shoulder since 6/10, the trend is broken on a closing basis below $68.70."

And the Trend Channel now...
As I had said, the Trend Channel (one of our proprietary indicators) held the entire move since 6/10 on a closing basis, however it stopped out at the close of 6/24. The Trend Channel will NEVER take you out at the exact top and even after it is broken price can flip flop around in "volatility spasms", but after a decade of using it, I've found once the Trend Channel is broken, you are usually best off exiting the trade as you "may" hit a higher exit by chance, but more often than not, all of the easy gains are far behind and what you are left with is largely lateral volatility. Typically you'll find having exited at the stop out usually gives you the best return as volatility and unpredictability after that often result in gaps down below the initial trend channel exit.

Finally from Tuesday's update at 12:18 p.m.,

"Typically with a Doji/Star as a reversal candle, the confirmation candle of a downside reversal in about 50% of the cases over the next day or two, will gap up and then close down forming a bearish engulfing candle, confirming the downside reversal, that gap up with the 1-5 min charts going negative is an ideal entry and the lowest risk entry for a SCTY short position which I'd view as a longer term trending trade because of the size of the top.

I'll be setting alerts for a move/gap above $71.20 to look at a short in SCTY."

On 6/24 we didn't end the day with a Doji star (yellow arrow) as we had seen around noon time, but the numerous small bodies Stars (in the yellow box) are an indication of a loss of momentum and open SCTY up to a downside move.

The set-up I had envisioned as laid out above from the 6/24 "Trade Set-Up" was a gap up, thus the reason to set alerts above $71.20 on the open (which still haven''t been hit) as most decent bearish reversal confirmation candles start with a gap up and close lower like this bearish engulfing candle I attempted to draw in at the red arrow. The idea is to check the opening 3C charts on such a move, look for signs of distribution and enter there, however on a "bigger picture" basis, this is actually an excellent entry in this area with low risk as a stop can be placed a bit above the recent highs so long as it's not at an obvious place like whole numbers or resistance areas like $72.18.

As for other charts...

We do have a current sell signal on my custom DeMark-inspired Buy/Sell indicator..
The signals here have been pretty accurate.

Other 3C charts...
 The 1 min

An intraday view of the 1 min, there was some apparent accumulation in to the June 24th closing lows that sent SCTY higher, at the same time it loks like that was an intentional set-up to sell in to higher prices.

The 3 min chart shows the same negative divegrence in to higher prices today.

 Since you've already seen the 5 min chart, here's a different view, also with some accumulation on the 24th to send SCTY higher and apparent distribution in to higher prices.

And the 15 min trend through the H&S top pattern. 3C should make higher highs with price , if you look at where price is at point A and point B, you can see there are no higher highs in to higher prices which would be the head of the H&S pattern and at point C which has higher prices than point A, 3C is significantly lower.

That said, SCTY has been one of the strongest performers, just look at it's performance as a momentum stock pick, 41% vs the next closest, FB at 16% and volume has been rather high on the right shoulder which is not what we normally want to see with a H&S top.

For these reasons, I'm still an advocate of a gap up with confirmed 3C distribution, the set up I drew above with the candlesticks, this gives you a better entry and much lower risk as a stop can be placed right above the gap up if it ends the day as a bearish engulfing confirmation candle.