Thursday, January 22, 2015

NFLX Follow Up

This is a follow up to yesterday's post earnings, NFLX trade Set-Up post.

So far, so good, but again, things don't just suddenly reverse. The one lesson I've had to learn and re-learn (refresher courses) is that when you watch the market as closely as many of us do, we expect things to happen quicker. My general rule of thumb is whatever timeframe or percentage move seems reasonable, at least double it as the market moves in extremes.

As we were talking about yesterday relating to the ECB, F_O_M_C knee jerk reactions, Cramer etc. is that the market is driven by perception.  If you went to business school, price is dictated by supply and demand, but if you have seen multiple concepts that we use that work in all timeframes in every asset you can trade, what you realize is that this fractal behavior is possible for one reason only and that is while supply and demand may move prices, the direct driver of supply and demand is human emotion, fear and greed, that's what ultimately moves the market and why, "PERCEPTION" is so important.

that all being said, the point is simply NFLX as a trade set up is doing what it should do, what we expected it to do (see NFLX trade Set-Up ) and this is a process, not an event.

 Daily NFLX, the reason I include this is from yesterday's post, the  gap fill.

As for intraday activity, the negative divergence yesterday in 3C shows up in lower 3C highs and lows in white. Today's activity has continued on the same path and is represented in red.

 The longer term chart at 10 mins which we want to see continue to lead negative is in decent position, but ultimately before we're ready to start making any new moves, we need to get to the 15 min chart.

This is still in line, when the 10 min chart starts to see more deterioration it will move over to this 15 min chart and that's when we'll be in the zone.

In any case, again , so far so good. Another example of how deceptive price action can be.

MCP Update

Nothing has changed much in the MCP charts I can see and trust, see the last MCP update from this week, MCP Update.

The same rounding bottom is still there with today's potential capitulation move.

 Huge volume intraday (10 min)...

Now on the daily, if price just comes off the lows, we have something to work with.

Usually I'd confirm with the short term 3C charts, but as explained in this week's earlier post, trade is too thin to get good signals on the short term charts needed for this kind of confirmation, otherwise, this looks exactly like the kind of set up I'd normally be buying calls in to.

Keep an eye on this one, a positive reversal candle on this volume is a significant change for MCP, especially considering the earlier charts posted this week and the rounding bottom.


General Market Update

Since everyone pretty much knows what we have been looking for and now we are getting it, I don't want to clog up your inbox with a bunch of posts just to let you know I'm here and you are not missing out on something big that is happening.

Selling in to strength is a process, it's been underway, it looks to be continuing. The one question I have is how aggressively? Earlier in the month we had a base set up for a true oversold bounce that didn't last 2 days before aggressively being sold.

I'll post alerts on the usual things, intraday moves that look like they could be tradable, any additional information, but for the most part we are on the track of expectations and we just need to be patient and let it play out and when we are in the right place, we'll take action, but as I said, I don't want to just send out a bunch of posts that aren't really anything unexpected or things we've already discussed before. I'll send you anything that is standing out, anything that is truly material.

As for the major averages, we are right where we expected to be or at least where we expected to be heading...

 SPY daily- the top trendline across the chart is the top of the Broadening top and the yellow areas are two head fake moves or failed breakouts that would tell technical traders that the tp formation is negatived, luring them in to going long on confirmation breakout signals, creating bull traps that promptly dumped.

To the right is the bearish "Descending Triangle" which technical traders would expect to break to the downside, as we've posted this week, we are looking for a break above the triangle first, part of our bounce, part of a head fake move. In fact out earliest minimum targets were for a move above the January highs which we are approaching.

So this is what we expected to see (I covered this scenario extensively yesterday), so nothing really exciting or unexpected here.


The Q's have the same larger Broadening top and the same Descending Triangle and the same break out above the triangle, again, as expected.

 Remember that IWM range and the Crazy Ivan shakeout? The important move for a bearish, larger move is the IWM below the range now that it head faked above and popped back in. Stops should be lined up just below the range so we'll also be looking for a move in the IWM below the area of $114-ish.

 Transports breaking a nearly 2 year trend up at the first yellow box, a Crazy Ivan with a false or failed breakout above the range at the second yellow box and a flag-like price pattern, I don't have a specific target here, but it would be well within our concepts if we saw a move above the flag's top resistance trendline.

As for price action, I'll use the Q's as an example...
 The intraday chart stays in line long enough to allow higher prices and at those higher prices we see negative 3C activity just as expected (selling in to price strength).

This is accruing or migrating to longer charts as we have seen, in this case the 2 min chart. This isn't a screaming signal as of yet, it's just evidence of our expectations coming true.

Here's a broader perspective of 3C activity on a 5 min chart showing several different areas including the last failed base area so we still have some work to do, but we are progressing on track.

I noticed some dislocation in HYG this morning, this will be an important early warning signal. It still has a base large enough to continue to act as a lever and support for the market, however there are some dents in the armor and this is one of the best early warning leading indicators in either direction.

The HYG 2 min chart as you see is building a stronger negative divegrence, but it is not yet at the point in which it has used up all of the gas in the tank so again, the process and moves expected are underway and expectations of how the market would behave during this period are thus far confirmed.

So I'm not going to post every jot and tittle intraday that really doesn't mean anything, I'd rather and I think you'd rather I spend the time looking for important things and opportunities.

Basically put, so far so good.

Opening Indications

After a 2 year tease, "Whatever it takes"...Mario Draghi 2012; the ECB has launched its article 123 contradicting "Expanded Asset Purchase" program building on the purchase program already in place of ABS and covered bonds.

The $60 bn a month was a little higher than consensus for a monthly figure, the total at 16 months of 1.1 trn Euros was below the aggressive whisper number of 1 trn a year. Perhaps one of the biggest mistakes the ECB made was to make the program limited to 16 months rather than open-ended, of course they can do whatever they want in 16 months, but it seems the market prefers open-ended.

There have been a lot of knee jerk moves this morning, surprisingly, not as volatile as one might have expected, but this was the longest QE tease in modern Central banking. Some knee jerk moves don't look as likely to stick as others.

Stocks are certainly not looking like today is anything special and as far as "sell the strength, other than premarket knee jerks, we haven't really had a chance to see much of what the market will do as today doesn't look much different than any other normal day.

EU Peripheral bond spreads such as Spain and Italy are seeing elevated risk spreads.

As to the charts, the futures charts around the announcement look a little more impressive than the actual cash market charts.

 ES knee jerking higher and then giving up all QE gains...

EUR/USD lower as would be expected.

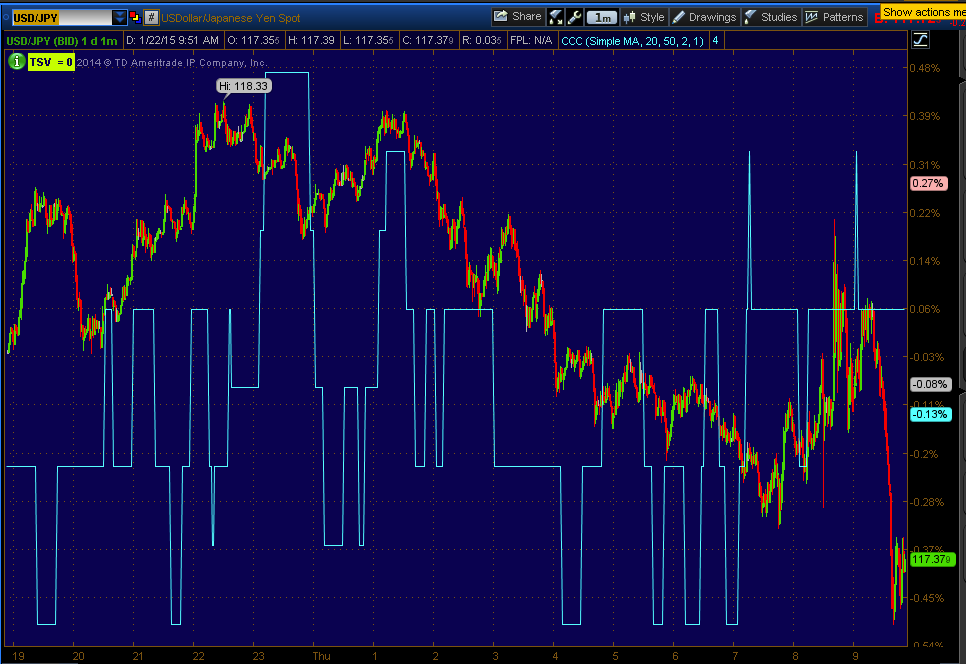
USD/JPY also taking a hit. I suspect the pair will find some footing soon and possibly reverse to the upside shortly.

 Crude's initial pump and then dump, however I think USO near term expectations are still on track.

Gold's initial pop higher, but I think near term GLD expectations are still on track.

 30 year treasury futures...

 This is the intraday 1 m GLD chart, so far it looks a lot like yesterday's smack down of the gap up, one of the reasons I suspect near term GLD expectations (pullback) are still on track.

The USO chart , despite pre-market volatility , didn't move below the range and it's larger divergence for a move higher is still very much intact.

SPY 1 min fading the opening gap on an intraday opening negative divergence.

 The 3m base chart/divergence is still intact.

QQQ, but all of this action was from yesterday.

including the 2 min chart. The question for the very near term is whether charts like this get worse in to some price strength and migrate to longer charts showing the bounce phase is coming to an end.

 IWM 1 min is a mess, nothing really to see here.

However the 2 min has a trend, it's from before today as of now.

And its 3 min base is still intact for the time being.

TICK as you see hasn't made any spectacular moves this morning, again, it looks like an average day as if nothing happened so far.

ECB QE

As widely expected and just a bit above yesterday's trial balloon leak, the ECB will launch or rather "Expand" asset purchases to $60 Billion a month starting with Agency Debt in March. The program is scheduled for 16 months (Sept 2016) which puts it right at the market consensus of 1 trn Euro (1.06 trn).

So far this is the market's reaction or at least the SPX's futures/ ES.


Wednesday, January 21, 2015

NFLX trade Set-Up

Yesterday after hours, NFLX put out earnings and had an interesting reaction to them. We often see earnings that don't exactly make sense, usually they'll beat or miss and move the opposite direction that you'd expect and that usually is because Guidance which is not typically part of the top/bottom line earnings, is what matters most.

In NFLX's case, an open longer term core short position for us that's still at a +14.35% and +2% gain  even after yesterday, things are a bit more complicated than the headline earning's print.

As such, a few members have asked me to keep an eye on it which I intended to any way and to make a long story short, while I don't think this is the exact moment to enter any new positions in NFLX, I'm not concerned about the long term core short position and I think given a little time, we'll likely have a great entry for new or add to positions (short).

First earnings came in with Q4 EPS of $1.35, nearly double the $0.72 expected which started a massive short squeeze in after hours last night.

While EPS beat, Revenues missed expectations of $1.49Bn, printing at $1.48Bn, yet EPS was nearly double consensus, how?

Here's how: NFLX Q4’14 Net Income/EPS includes a $39m / $0.63 benefit from a tax accrual release related to resolution of tax audit if traders bothered to read the full earnings, but with algos trading at supersonic speed, no one has time for that anymore.

 If you subtract the $.63 per share from the $1.35 EPS print, you get... $.72%, right at consensus/expectations.

I don't like Jim Cramer, but I'm not going to say he's a buffoon, he's a smart guy, but he only shares that wisdom in rare instances, in my opinion the rest of the time he's more vested in his Wall Street buddies who are in a far greater position to help him out than he is in his viewers, but that's my opinion and I'm probably the last person to give an opinion considering I don't watch CNBC or Cramer.

However in a Street.com interview he gave to Aaron Task years ago before the first I-Phone came out, one I suspect many people including himself wish he hadn't given, he was remarkably candid in talking about how Wall Street and he himself would move the market through less than ethical means. They'd create an atmosphere that traders would follow and then they'd fade that to make a long story short. I think some would call it market manipulation, I believe he called it a "Grey area" and said he did it as a fund manager, it was fun and anyone who was not willing to do it, shouldn't be in the game. 

I use to start all of my Technical Analysis classes (when I taught Technical Analysis for the Public School system's adult education program for nearly 4 years) with this video/interview and I can't tell you how disheartened everyone in the class looked after hearing it, they realized the market is not a fair and level playing field, that everything they believed was bunk and they heard it straight from the mouth of someone most of them probably watched every night. I'd purposefully show this not to dishearten people, but to let them know what the reality of what they were up against actually was and more often than not, you have to think like these criminals to beat them.

However, the point about Cramer was he said one of the truest things you'll ever hear about the market ad I paraphrase, "The market is not about value, earnings, etc. THE MARKET IS ABOUT PERCEPTIONS".

We have forecasted this in advance before an F_O_M_C_ policy statement as 3C showed a small stage 1 base for a bounce/rally in place almost a week before the F_O_M_C and it fired off at the policy statement on a knee jerk reaction and as I always warn, "Beware the knee jerk reaction, they are almost always wrong" and then after some time the entirety of the F_O_M_C gains were retraced.

Again the point being, at the speed of trading these days, the reaction is out far before the entirety of the information is out and as such, it's the reaction (price movement) that dictates the initial "perception" of the information. For example, take the December 16/17th F_O_M_C meeting, I had warned about this back then, that there was a small base in place and that the knee jerk reaction was going to define the policy statement despite what it actually said...

Here are some excerpts from posts on the 17th of December (F_O_M_C announcement at 2 p.m. that day)...

A.M. Update

"The 7 min charts are starting to really look impressive ... I suspect we will likely see the IWM move ABOVE the range soon enough, I would think today either in to the 2 p.m. F_O_M_C or at the press conference after....Remember this is not a move that can last...I'd sell short in to the move at the appropriate time or just be patient and continue to manage shorts that have been doing well, they'll come back  with a sharper downturn when this is all over"

Market Update at 11:45 a.m.

"As for the scenario... HYG has been one of the biggest give-aways that this scenario was on track. The accumulation I've seen the last several days in HYG (as well as other places like the averages/Index Futures)..has been screaming "Set-Up". There's only 1 good reason to accumulate HYG even in small size while HY credit and even investment grade credit is breaking down and that's to use it as a leading lever to manipulate the market higher when it doesn't have the strength to do it on its own."

Levers In Action @ 1:34 p.m.

"While I believe TLT will head higher, near term it is being used as a ramp today...5 year yields, a leading indicator are leading the SPX higher today...30 year yields, part of our TLT analysis are leading the market today as we have been forecasting due to 3C signals in treasuries....The most obvious lever of all, HYG as there's only 1 reason to accumulate it as they have this week in such an environment and you see the reason on this chart as HYG leads the SPX higher as one of our best leading indicators...And the 4th is the simple USD/JPY, which is also leading the market today."


"In any case the F_O_M_C is in less than an hour, while I don't think the signals this week and price move are an F_O_M_C leak, otherwise the averages would have more accumulation, price initially determines how the F_O_M_C is received even if it is very hawkish, if the market is rallying, the knee jerk response will be that it was favorable and it provides the perfect cover, obviously considered when we first considered this Friday/Saturday."


These are just a few excerpts from a few posts, on the day of the F_O_M_C. Here's what the 3C SPY chart looked like in to the F_O_M_C...

 5 min SPY positive divegrence in to the December 17th F_O_M_C policy announcement, along with all of the levers (all 4 ) activated the same day, virtually guaranteed an upside knee jerk response no matter what the F_E_D said.

I also warned above on the same day, that the knee jerk move wouldn't hold...
 Here's the F_O_M_C on the 17th at 2 p.m. and the market retracing all knee jerk gains.

And here's the 3C negative divegrence in to higher prices setting up the retracement of those gains whether selling longs in to strength that were accumulated just before or setting up short positions for the downside retrace.

By now it should be clear that it is the market's reaction (price) that determines how information is initially PERCEIVED which is all that really matters to the market, PERCEPTION.

SO BACK TO NFLX...

So we have Revenues that missed. We have EPS that actually came right in at consensus and additionally and perhaps most importantly...

Q1 guidance, at $0.60 which is not only lower than a year ago, but also substantially below expectations of $0.78. This is the killer of earnings, even a strong beat will sell-off on poor guidance because it's not what you did, it's what you'll likely do in the future and if guidance is calling for less EPS than a year ago, less than expected, there's few good reasons to stick it pout long NFLX, you could say (at least for the time), they have created and it doesn't get any better than this, in which case, there's no reason to expect NFLX to sustain higher prices.

Additionally, Free Cash Flow. At ($78) million, this was the worst quarter for the company in years.

So why did NFLX pop over +17% today... Well just like the pre-F_O_M_C set up, just like the "bounce" set up now right in front of tomorrow's ECB meeting... NFLX was already set to ramp higher as you'll see on the charts below...

 First the daily longer term chart is a lot like the SPX's Broadening Top and there's resistance at a gap just a bit above, thus NFLX didn't only move up on earnings. but completed (nearly) a gap fill which I suspect had some market makers trapped with inventory at higher levels they needed to exit. The market has been ruthless over the last 5 years about filling gaps unlike before QE so I'd say it's safe to assume part of the plan for NFLX despite earnings, was to create an atmosphere or a perception that earnings were good with price as price put that perception out there long before anyone could finish reading earnings. People rarely argue or doubt price, even with a horrid earnings report like this, they just go along, but that' not always a great idea as we already saw with the last F_O_M_C that has already retraced all gains.


 The daily NFLX chart shows a stage 1 base, stage 2 mark-up and a stage 3 top (Broadening) with the appropriate long term daily negative divergence at the top. The next stage is 4, decline.

However as you can see, before earnings were released, NFLX was already set for a pop higher,

I doubt this was on a leak as earnings were pretty ugly, it was more likely on the need for a gap fill.

Again, the 15 min chart was set up in advance for a move higher near term.

As of today, the intraday charts already started showing strong leading negative divergences like this 1 min chart.

Which was strong enough to migrate to long timeframes like the 2 min

And 3 min

in fact out to the 10 min chart in a single day, so there's some heavy distribution underway.

What we need to see is the a5 min charts go negative, once that happens, NFLX should be approaching a great area for a short set up at higher prices and much lower risk. The longer term charts point to that, the charts today on the move to fill the gap point to that.

As you know, while it sounds nice and we'd like to see it, the market rarely sees a reversal down from a move like this on a dime, it's a topping/reversal process, not an event unless some fundamental data changes that, so I'd look for a topping process over the next days and week/s, it probably will have something to do with what the broader market does and when its bounce is over.

All of that being said, all objective information we have suggests NFLX will be or already is a great looking short position, for new entries it's more about timing than anything and at the rate we saw the charts move today, I think NFLX will probably be ready about the same time the broader market is ready to roll over from the bounce it has set up and in place, which is probably (just like the F_O_M_C) set up as a sentiment mover for the ECB policy due out tomorrow, whether it disappoints or not, in the short term on a knee jerk response, it's perception and price leads that, then the details and truth set in and the market responds appropriately.


HYG Save, Still Mixed Up Signals

I'll just use QQQ as an example, although each average is a bit different, we know the Q's put in a move that could be sold in to.

As mentioned in the last update, HYG looked to be active and activated on the market's intraday , afternoon turn to the downside, likely effecting a rescue as it wasn't that harsh of a move to slow and reverse on intraday charts.

I suspect there may be some buying in to the close on ECB anticipation as well.

 QQQ 1 min negative from yesterday and today and the most recent positive, likely with some HYG help. It's clear it's not a strong positive intraday, it doesn't even have any kind of intraday base.

 The damage to the 2 min chart above and 3 min chart below remains.

3 min

And while there's some 5 min chart damage to the far right on apparent selling in to higher prices, the gas in the tank for the bounce divegrence (white) is still more than sufficient to get a bounce off, this is really why I haven't made any kind of near term trend expectation changes.

Again, the theme is pretty close, but each average is a bit different, likely based on their relative performance,  you can't sell in to something that's red on the day.

The 5 min Index future charts are by and large, worse on the day, even in to this latest afternoon stick save.
 ES 5 min worse on the day specifically.

And now the 7 min ES chart has joined the 7 min NQ chart and is showing a negative on the day as well. This is clearly not as bad as NQ and TF is still in line, but the trend pointed out yesterday of small, constant negative signals continues today.


Leading Indicators- Second Verse Same as the First...

So after looking at Leading Indicators, a lot of the deterioration I was documenting yesterday and last night in the Daily Wrap, continues today.

Again, I can't say at this point this is enough to change short term expectations, but at best, it's not helpful in any way I can conceive.

Lets just dive in...

 The same SPX:RUT Ratio (red) indicator that has been showing deterioration since the VIX Term Structure Buy signal (White painted on price bars and below) is again showing non-confirmation and more deterioration today.

The VIX TS buy signal is not failed, it has been several days early in the past and the SPX:RUT put in a positive signal in to the bottom area where the VIX TS gave a buy signal. It is just that today we see a continuation of yesterday's weakness and weakness that started developing before that.

While the SPX:RUT Ratio is a specific indicator performing a specific function, you can get the same net result with Wilder's RSI such as the chart above on a daily showing divergences/sell signals at both areas in the yellow boxes and a positive divegrence in the area of the Descending Triangle I've posted several times as a perfect head fake price pattern and set up.

A closer look at the same RSI on a 10 min chart shows the same positive at the triangle lows and a negative in to recent movement higher.

And on an even faster 5 min chart you can see the negative signal today specifically. Stochastics as well as ACD or any Oscillator used in divergence mode rather than overbought/oversold, should give roughly the same signals.

It appears that HYG (High Yield Corporate Credit), one of the most popular levers for ramping a market, has been trying to stem the afternoon price decline and looks like it may have, but this may tell us that higher prices were aggressively sold in to , thus the need for HYG as a ramping mechanism.

When looking at HYG's intraday 1 min 3C chart, you can see a positive divegrence as if they were trying to use HYG to stem afternoon downside, which could suggest (a few things),  that they want to get this bounce off, however there's significant selling pressure on any price strength. Thus HYG may have been used to keep the base from falling apart with a deeper downside move.

The intraday roundtrip volatility similar to yesterday is also worth noting.

Again, not all, but one of the HY Credit assets I use most continues for another day to register negative. This is not across all HY assets I look at and that's why I'm not making a big deal of it , but it is notable.

And pro sentiment is falling for a second day which is notable because it has been such a strong leader both in to negative moves and positive ones.

We still don't have a smoking gun and this may all be a wash, but the trends of mild deterioration continue.