Tuesday, April 21, 2015

AAPL Update + Market Proxy

AAPL was the example asset of choice for the April 2nd forecast because it best represented at the time the numerous triangles and pinching volatility indicative of a highly directional move and it was just by chance were I was when I decided I had seen enough, enough stocks and market averages were all acting in similar fashion which has been right in line with the 4/2 forecast and subsequent forecasts for each week.

The fact however remains that AAPL didn't make much of a triangle based breakout, it actually didn't start until yesterday after last week's head fake/Crazy Ivan shakeout and momentum producing head fake move.

In looking at several assets that are high on my watchlist, NFLX, Transports, AAPL, they all have a feel of a bit more time and patience, I may have a different opinion as I continue to go through additional charts, but even the $USD from the Futures update just a bit ago doesn't rule out a little additional strength in the $USD before returning to a larger primary downtrend.

For AAPL, here's what we have... I really anticipated that AAPL would move well before this week, but it has at least finally started a move.

 This is the rough triangle in AAPL used as a market proxy for the 4/2 post. Friday's move below the apex on volume was a stop run, the first part of a 2-part shakeout on both sides of the apex. Shorts who may have chased price below the price pattern's apex on Friday were squeezed yesterday, once of the reasons head fake moves are used as they don't require actual investment to create motion, especially if it's investment you are trying to take the other side of, but need movement nonetheless.

(yellow arrow was Friday's head fake below the apex-mini bear trap and short squeeze yesterday).
 The triangle like a pair of Bollinger Bands is the promise of a highly directional move in the near future, look at the difference in the width of the bands at the orange areas at 1 & 2 and compare to the pinching of the triangle, this is what the general market expectations were based on near term.


 The larger multi-day 3C chart for AAPL shows the Dan Loeb / Third Point highs when Dan exited AAPL and caused a hedge fund herd stampeded taking AAPL down -45% in 8 months. I've shown numerous charts that the recovery to new highs in AAPL is not exactly what it seems and have encouraged everyone to look at the MSFT growth story, what happened after they went through a similar experience, declared  dividend, share buybacks , etc. The growth story ended.

The 4-day chart shows the 2009 market bottom (white) the general uptrend confirmation in to the 2012 highs and distribution as we were calling for a move lower right as AAPL was the market darling that could do no wrong, then Dan Loeb's S_E_C filing came out without AAPL in the top 5 holdings causing a hedge fund herd stampede out the door leaving AAPL down 45% in 8 months. The bounce to new highs since then is not all it has appeared to be as this chart shows at #2.


 And recently on a 4 hour chart in to the triangle area and 2015, there's a clear change in the 3C trend.

 Just as the more detailed 2 hour chart shows a similar negative trend in to the triangle which is why I'm anxious to use an upside breakout in AAPL as a potential short set up. As I said when we saw AAPL's signals, you could play it long, but probabilities and letting the trade come to you seemed like a far better position to take, if not a more patient one.

 AAPL 60 min "seems" to show initial distribution on a fairly strong chart in to the initial triangle based breakout, although this is very early. This is also one of the reasons I believe we have a little more time and need not be too overwhelmed or rushed, perhaps the SPX head fake move is still on, probabilities always favor such a move about 80% of the time in any asset and any timeframe, even more for a popular asset and a stronger resistance/support/price pattern that is more easily recognizable and more likely to cause traders to act.


 The 15 min chart, like the averages, is showing a negative divergence in to the initial breakout yesterday.

 Intraday 1 min (from the other end to se migration) shows a clear trend of distribution in to higher prices.

We have a stronger divergence as it migrated to the next longest timeframe at 2 min with Friday's head fake on positive divergence seen in yellow.

The 3 min trend is also showing migration.

However I would not consider AAPL a short yet, maybe on an equity short basis with a reasonably wide stop considering this hasn't made a primary trend reversal, but for put positions and the like, I prefer the best timing I can find and in looking in several of the assets I've been watching closely they resemble AAPL, close and in many ways getting  edgy to take action, but also looks like there's a bit more to go and I think it may have something to do with the SPX head fake probability.


Quick Futures Update

Once again, yesterday's Daily Wrap comments about the internals and Dominant Price/Volume Relationship seem to be right on...

""Internals...
Ironically in almost perfect opposition to Friday's oversold condition in P/V relationships and sector performance, today was near the EXACT opposite.

The Dominant Price/Volume Relationship once again hit extremes in all 4 major averages, but unlike Friday's solidly near term (1-day) oversold, today was the most bearish of the 4 relationships, Price Up /Volume Down. There were 21 Dow stocks, 82 of the NDX 100! 1018 of the Russell 2000 and a walloping 316 of the SPX 500 (of 4 possible relationships), this is extremely dominant. 

While I'd normally say this is a 1-day overbought condition, it can also be interpreted as a VERY weak upside move that is failing, we still have that SPX trendline head fake area just above around $2115 which would make for an excellent set of trade set ups as mentioned in Friday's Daily Wrap, especially put positions."

The red part obviously being the point of the entire data series. Although there's a ton of things to look at and post on, the general thrust of the last paragraph seems to be right on track.

The VIX (/VX) actual futures, rarely post divergences beyond a 1 to 5 minute chart for whatever reason (this is not the same as VXX-Short term VIX futures), but today, they are positing positive divergences in some very strong timeframes suggesting some very deep pockets are hedging or buying outright protection. It will be interesting to see if the SKEW Index (Black Swan Index) sees a rise tonight.

 5 min VIX Futures (/VX) with a leading positive divergence.

Usually I don't see much beyond this point.

Here are the 7 min VX futures positive as well with a lot of action coming today alone which fits the Internals post from the Daily Wrap, that any additional gains in the market would be in a very weak, unhealthy environment.

 I was surprised to see a leading positive 10 min VX chart

15 min as well...

And even a 30 min leading positive divergence. Even the 60 min chart shows signs of a positive divegrence.

This is rapidly forming, meaning it's not retail over a longer period as it would take quite a while to hit some of these longer term charts, even at 5 and 7 min, but 30 and 60 min positives in a day is big money changing hands and VIX is a Flight to Protection trade.

As for the highest probability resolution, we have known that since before the move higher off the April 2nd forecast (triangle-based breakouts such as AAPL yesterday).

Since the move forecasted on April 2nd, this is the 60 min ES chart which is confirming what we already knew as the highest probability before any real upside move started.
 ES 60 min shows the positive divgerence that was "part" of the analysis that went in to the April 2nd bounce/triangle-based volatility breakout which was fully expected to see distribution, fail and make a lower move like the $USDX which was also forecast to bounce, then make a larger move to the downside, perhaps changing the primary trend in the $USD which has all kinds of implications from carry trade to F_E_D interest rate hikes sooner than later and not least of all, its leading nature vs the SPX recently.

In any case, the 60 min Es/SPC futures confirmed what we expected to see in to any move higher, DISTRIBUTION.

That was based on the highest probability forecast of the ES daily chart which as you can see has been in a leading negative divergence for all of 2015. You think the Q4 2014 S_E_C filings showed strong distribution among leading fund managers, wait until the Q1 2015 filings come out (45 days after the end of the qtr. which was March 31st).

Remember one of 3 things I've been looking for is the 7-10-and 15 min charts to go negative in Index futures.

This 5 min ES chart confirms what was posted yesterday/last night in the Daily Wrap with regard to internals posted above from last night's post. Note diminishing volume and a deepening negative 5 min ES/SPX futures negative divergence.

As for the 7-15 min. timeframes, each average is a bit different, but overall we are largely there, I'd still like to wait for a line up of all on every timeframe screaming, but with VIX futures looking like this, we are so close it's hard not to be a little edgy. Also remember our analysis and forecast/expectations for Spot VIX which is winding up a coil of strength on a Crazy Ivan shakeout with its triangle's apex just nearby and the 50-day just above (VIX trades opposite the market).

As for those charts which were 1 of 3 conditions I've been looking for...
 TF/Russell 2000 7 min leading negative

TF/Russell 2000 10 min leading negative and again note the distribution since yesterday's forecast oversold bounce from Friday's oversold internal condition.

NQ/NASDAQ 100 Futures 15 min charts. leading negative in to last week and Friday's decline which produced a 1-day oversold condition with the bounce yesterday seeing even WORSE distribution in to the move on a significant timeframe.

As for the $USDX and it's position/forecast, although I think there's still some room for consolidate noise within the larger downtrend forecast after the initial bounce (from 4/2 forecast), I believe it moves lower ultimately and that has consequences on a great many things from carry trades to the F_E_D feeling better about hiking sooner to the leading indication the $USD has provided for the general market as well as the primary trend on a daily chart of the $USD negative and the Yen leading positive, the conditions I laid down nearly 2 years ago for a primary downtrend/bear market.

 Daily $USDX as forecasted on Tuesday April 2nd showing weakness "very short term", but expecting a bounce and then a larger move to the downside. You can see April 2nd at the white arrow and the temporary/short term weakness, the bounce at the green arrow which led the market and the reversal to the downside which has been forecast as a larger move to the downside.

Note for the first time in the $USD's trend of the last year + this is the first break not making a higher high, I anticipate a high probability that we see it make a lower low as well, ending the primary uptrend and starting something new within a downtrend, just as expected for the primary trend for the market (USD down/Yen up).


Here's Friday's leading $USD signal for a Monday market based/breadth based oversold 1-day condition and bounce expected Monday (yesterday) and the short term nature of the $USD support and the overall market support (weakness in the area) as there's a negative divegrence in to yesterday's $USD move higher after the biggest 4-day move down in a year in the $USDX from last week.

 The 15 min $USDX shows the Friday (white) area, positive divegrence for the bounce as the $USD has been leading the market) and the distribution in to the bounce, suggesting clearly the $USDX has more downside to go as this was a minor trend interuption. There could be a bit more on a very short term basis, but overall I expect the $USD is probably going to make a lower low for the first time in the primary uptrend and EVERYTHING changes, remember $9 trillion id $USD carry based (approx.) outstanding at 100-300:1 leverage, this can snowball quickly and it's not positive for the market despite the old legacy arbitrage correlation of lower $USD higher risk assets (stocks, gold, oil), a carry trade unwind is quite different.

The point being, we have exceptional weakness in the area and it's hard to stay patient here looking for the best pivot to keep us out of meat grinder chop and entering at the best time we can find in the best assets. I just thought you should know about the condition of the market, the $USD's role and protection being seriously bid.


NFLX Update / Trade Set-Up

I'm spending much more time going through watchlists than usual. Yesterday's Dominant Price/Volume Relationship among the component stocks of the major averages is typically associated with a 1-day overbought condition and a red close the following day just as Friday's Dominant P/V relationship was extremely strong and associated with a 1-day oversold condition and a green close the following day which was yesterday. As I stated last night, the other interpretation that I would not normally make except that the market hasn't gone far in a single day to make a true overbought condition believable and the internals were simply not that strong to support that view, unlike Friday's which hit some extreme levels. So last night's interpretation of the internals including the sector performance was that the market was weakening in to a bounce such as yesterday's and the 3C charts from SPY used as an example or proxy for the broad market suggested that was the case.

That makes any near term price gains in the area of watchlist short assets very attractive in to all kinds of weakness (breadth, underlying, leading indicators, etc).

However as I also said last night, I don't see the market's strength or ability to lift the market on its own, it seems to me it would need either a fundamental event that have been ugly overnight or perhaps a technical one like the head fake/false breakout I have been talking about since last week (originally thought to form as part of the range of the reversal process until the March SPX trendline has held as resistance so many times and is the far wider viewed resistance area). Thus a technical breakout would cause short covering, longs chasing and create the momentum without any underlying strength, this is half of the process or the means that lead to the end of a head fake move, which in this case would be a failed breakout/bull trap.

For example, for the SPX, which would have the greatest influence on stocks generally such as NFLX...
 SPX daily chart/Triangle and CLEAR resistance tested several times. Wall Street knows exactly how technical traders will react to such a heavily watched index such as the SPX breaking out above a trendline that has held as resistance 4+ times. This is the easiest way for Wall St. to create movement and its movement they need to fill positions, for example to sell or short NFLX they need demand and higher prices, both work together so their larger orders don't work against them and they know exactly how Technical traders would respond which is the same reason we have been watching it so carefully. Someone has to hold the bag. This is to say nothing of the head fake concept which you can read about linked on the member's site at the top right in the 2 articled "Understanding the Head-Fake Move".

As for NFLX, this is to say nothing of the atrocious earnings with pro forma FX losses used as put backs to effect the bottom line, it's accounting gimmicks, not to mention other things like the new subscriber growth coming at a cost of -20% for a new subscriber and the new NFLX record cash burn, blowing through $126 million for just the first quarter. This is similar to the last NFLX earning's gap up that we shorted at the very top as we identified an accumulation area before earnings, it doesn't matter what the earnings are on the knee jerk reaction, it matters what the perception of earnings are and price gapping up sets a perception, but remember it is a perception and one that Wall St. is happy to let retail believe as they unload shares of what is otherwise showing itself to be a real dog right there in its own earnings report if any of these momo chasers, like the ones who chased TSLA's model "W" WATCH on an April; Fool's practical joke. This is textbook bubble behavior, China is probably the sharpest example of it globally.

In any case, most stocks will move directionally with the market so whether there's gas in the tank or not right here is irrelevant, a break above that trendline and retail will do the work.

As for NFLX in the area, I still like the short equity position, I probably would have very little argument with an NFLX short equity position in the area after thee earnings inspired knee jerk reaction, not based on earnings, but the nano-second response of HFT's that set the tone and the perception of earnings long before anyone can read and understand them.

As for puts though, some of you have asked and I've put together numerous price alerts, I don't like chasing them on a day like today, down -1.15%, I like entering puts on strength in price, weakness in 3C and the overall market. So a bounce in NFLX would be most appropriate for puts and between the short term intraday charts and the SPX possoibility/probability of a head fake move, I think we get the set up in NFLX without chasing weakness, but in to price strength at a discount and lower risk.

Her's NFLX with a similar "Broadening Top like the SPX (not textbook, but they rarely are).
There are the 4 stages of a smaller cycle starting with stage 3 Top followed by stage 4 decline to the far left, REMEMBER THE VOLATILITY INCREASE DISCUSSION BETWEEN STAGE TRANSITIONS I MENTIONED YESTERDAY (and recent examples which are similar to the above chart)
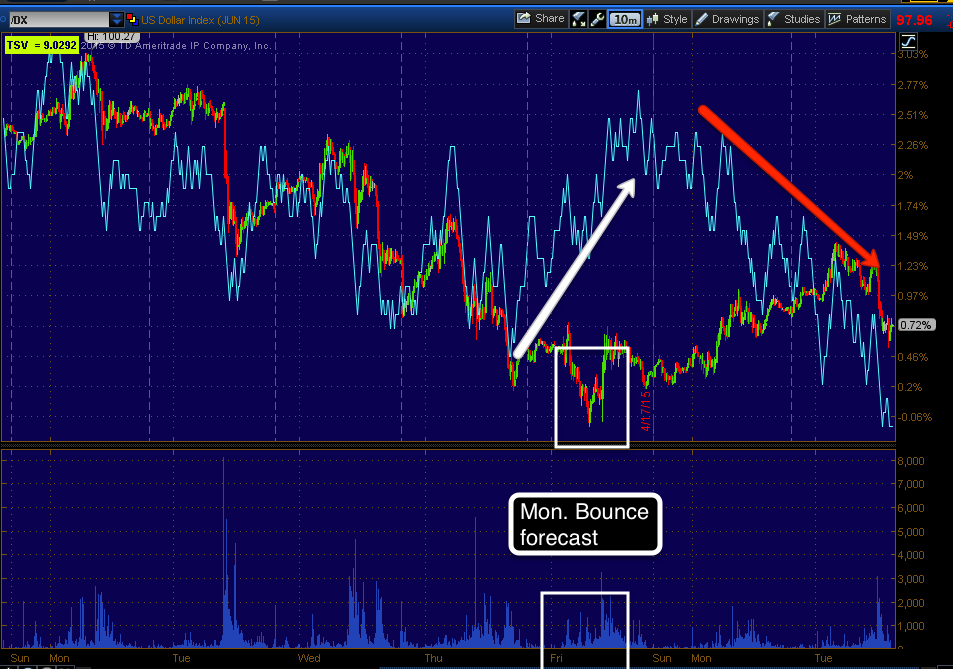
? At the red arrows just after stage 4 is one of those increases in volatility, a capitulation event. You may recall yesterday I said even after a selling/capitulation event, the market typically drifts lower in to stage 1 base which you can see at #1 as the rounding bottom even looks like a base area, then there's an increase in volatility with a breakaway gap up at the green arrow leading to stage 2 Mark-Up/Participation and if you look close you'll see the peeling away on the upside from the trend line at the end of stage 2 and in to the large stage 3 Broadening Top right around the yellow #2. The yellow numbers represent the approximate 5 points of contact seen most commonly in a Broadening Top, this would be stage 3 (TOP).

The recent move to the far right above the Broadening Top is considered a head fake move so long a it is confirmed with distribution, in other words a soon to be failed breakout attempt. This is how Wall Street uses nearly century old price patterns against technical traders who see the Broadening Top (it's a real top), but T.A. traders are taught that if the pattern fails, to change course and in this case, go long NFLX and chase price which suits Wall Street's needs just fine.

THIS IS JUST ONE EXAMPLE OF HOW WALL STREET USES TECHNICAL ANALYSIS DOGMA AGAINST TECHNICAL TRADERS AND HOW WE CAN USE IT TO OUR ADVANTAGE JUST AS WALL STREET DOES.

The Broadening top is way bigger than the 4 stage trend seen since the base (stage 1) on the chart above this one, I believe you have to look at the complete primary trend to see a top pattern that is proportional as it was too big for the previous chart, it is right in line with this longer term chart and shrinking volume on the last uptrend, note the first sees rising volume with price as should be the case.

The price/volume action at the red arrow is highly suspect and hints that institutional sponsorship needed for support to prevent any real and sharp declines is simply not there.

The red arrow is the last NFLX short we entered after the last earnings gimmick, it was right at the highs of the move to the very day after a month of waiting, which I'm not currently suggesting. A head fake move like this one would tend to fail much quicker depending on whether there was accumulation before the move like the last earnings and if so, how much gas in the tank?

The 60 min NFLX chart suggests there was no serious gas in the tank for this earnings move, it also shows a clear negative divergence right at the exact high in the trend where the last NFLX short position / Trade Idea was put out which hit double digit gains before our April 2nd forecast of a broad market bounce seen in the averages and the majority of the asset watchlist.

The 30 min chart shows the accumulation in advance (setting the earnings perceptions no matter what they were, it was already in place well before the last earnings (prior to Q1 earnings just out) and there's a smaller version of the same, you'll see like the broad market, AAPL and all of the watchlist stocks , April 2nd was an important date and for the market and NFLX has a lot more to do with a larger primary trend move than an earning's knee jerk reaction based on algos gapping NFLX at near light speed.

The 5 min chart of NFLX is probably why we are seeing recent weakness, the question is when looking for a trade set up is "Can we get in at a better area, a better price, less risk and better timing?" That's the difference between high probabilities and a high probability/low risk trade set up, the latter is what we want to look for.

The 15 min chart which went positive like most of the market and all of the market averages except IWM in to April 2nd's forecast for the market which has played out near flawlessly,  is turning, just like the SPY chart, but it looks like it has a bit more work to do suggesting we'll have a chance at a better entry in NFLX. As such I've set price alerts for areas $565-$576 to look for opportunities.

This 1 min intraday chart is showing a positive divergence right now, if it keeps up, it's suggesting NFLX gives us that upside opening that would be great for short equity positions, but I feel ok about them in this area, although I always want to find the best entry, but necessary for Put entry positions in my view.

As for the longer term view and highest probabilities for NFLX...
If you go back to the first chart above and the stages including stage 1 base/accumulation, you can see them all right here in divergences and the largest by far is the leading negative through the Broadening Top area, it's much larger than that which would be proportional with the base of 2012, thus it makes perfect sense that it is a primary trend, long term top for NFLX as shown on the longer daily chart (also above).

I'd set some price alerts if you have an interest in NFLX short or Puts.

Otherwise, I don't have a problem holding the equity short position as it is meant as a trend trade that can absorb some topping volatility, thus the lack of leverage on it.


NFLX Post on the Way...

A.M. Update

Looking for reasons for the overnight push higher in futures is pretty much a waste of time.
Futures (ES 1 min) up overnight on nothing but bad news, from bad to worse actually. There was a small negative divergence just after the European open and a positive after that sending futures higher and close to our head fake zone in the SPX.

I believe we had the best argument yesterday in the Daily Wrap:

"Internals...
Ironically in almost perfect opposition to Friday's oversold condition in P/V relationships and sector performance, today was near the EXACT opposite.

The Dominant Price/Volume Relationship once again hit extremes in all 4 major averages, but unlike Friday's solidly near term (1-day) oversold, today was the most bearish of the 4 relationships, Price Up /Volume Down. There were 21 Dow stocks, 82 of the NDX 100! 1018 of the Russell 2000 and a walloping 316 of the SPX 500 (of 4 possible relationships), this is extremely dominant. 

While I'd normally say this is a 1-day overbought condition, it can also be interpreted as a VERY weak upside move that is failing, we still have that SPX trendline head fake area just above around $2115 which would make for an excellent set of trade set ups as mentioned in Friday's Daily Wrap, especially put positions."

Overnight bad news goes to worse, first:

Major Chinese Developer Says It Can’t Pay Dollar Debts
Kaisa Group Holdings Ltd. became China’s first real estate company to default on its U.S. currency debt, capping a month of distress in bond markets amid an anti-corruption probe and fueling concern that losses will spread.

Fears that more debt defaults would be on the way as Kaisa was the proverbial "Canary in the coal mine" were confirmed only hours later. Also the market learned that the Chinese government would allow a free market to work and not bail them so bad got worse only a few hours later when:

China Sees First Bond Default by State Firm With Tianwei


This time a 3rd publicly listed company that is also a subsidiary of a Chinese state-owned firm, misses a bond interest payment, Baoding Tianwei Group Co. The government through the parent company did not intervene and rescue the Electrical company. Until now only private sector companies have defaulted in the domestic Chinese bond market.

If Bond traders didn't think the first overnight default was the start of something worse, they certainly do now.

Exacerbating matters even further is news from Europe. Greece has initiated soft capital controls in a bid to centralize and collect as much money as possible by confiscating local government reserves and send them to their central bank in what looks to be an imminent default, it seems the European Central Bank feels the same and was looking at ways of cutting back Greek banks' access to Emergency Lending (ELA) funds, the only thing that has kept them afloat.

ECB Is Studying Curbs on Greek Bank Support

Right now Greek banks are seeing deposit outflows of approx. several hundred million Euro every week, thus any tightening of access to ELA funds would almost certainly create a self-fulfilling bank run event.

Yet futures are higher overnight, of course this could be the entire "Good news is bade news " theme, but this kind of bad news really can't be good. This all looks a lot more like our analysis of internals last night laid out above and should set up some great opportunities just about now as everything is in line and the market situation is deteriorating evidenced by numerous factors, not the least of which were last night's internals, so we'll be looking at these watchlist assets that we have been patiently waiting on to hit the right levels and more importantly as demonstrated yesterday, the right time.


Monday, April 20, 2015

Daily Wrap

As posted first thing this morning in the A.m. Brief, the expectations of both "Week Ahead" posts as well as the Daily Wrap Friday, in addition to numerous other reasons, ended the post with the following which is one good reason in my view to take the time to learn about the lost art of "Volume Analysis"...

"Interestingly for next week , especially the early part, Today's Dominant P/V RElationship was SUPER Dominant across the board: 27 Dow stocks, 91 NASDAQ 100, 1141 Russell 2000 and 327 SPX 500, ALL CLOSE DOWN/VOLUME UP.

This is obviously a very bearish relationship, but it's also a strong 1-day oversold relationship and most commonly we see a short term oversold bounce the next day or so.

Of the 9 S&P sectors, ALL NINE WERE RED. Utilities were the best performer at -0.36% and Consumer Discretionary lagged at -1.48%.Of the 238 Morningstar groups, 226 were red.

Only 11 Dow stocks remain above their 50-day moving average, only 1010 (almost half) of the Russell 2000 are above their 50-day.

Overall, the market is at a deep 1-day oversold point so our forward looking analysis for early next week doesn't look so far off, a 1-day oversold bounce and INCREASED VOLATILITY sounds very reasonable here, that should be an excellent entry for positions, options/puts, etc."


As seen earlier today in Remember Volatility? the recent swings and ranges on a daily basis have seen the increase in volatility we have been looking for, even if price essentially remains flat on the year which in itself is a message of the market. As noted numerous times, I can't remember how many times I have posted that an average was green YTD or red YTD as they keep flopping back and forth, not at all the trend of the last 5+ years.

Friday after the Chinese markets closed, futures sank as low as -6%, the overnight PBoC RRR 100 basis point cut (18.5%) was the largest RRR cut by the People's Bank of China since 2008 and wreaked of panic. Furthermore, clarifications by market regulators were made to make clear they weren't trying to pop the bubble in Chinese stocks, as I said this morning in the A.m. Brief .

And why shouldn't they wreak of panic? I found this image of Chinese stock traders most amusing and most terrifying.
 No Joke!

 While the Shanghai Composite pared back some of those futures losses, not even a 100 basis point RRR cut (easing) from the central bank could close the Shanghai Comp green at a -1.64% loss. Note the Ultimate Oscillator divergence which is quite large, but even more impressive as we go down the list...

The Hang Seng which saw a parabolic move as regulations changed to allow more investment in the Index that sells the same stocks as Shanghai, but they were at significant discounts of up to -35% in some cases.

Now the candlestick price pattern looks like a classic TOWER TOP!  And with the Ultimate Oscillator divergent too on a parabolic move which I never trust anyway.

Take a look at Germany's DAX, if that doesn't look like a top with the U.O divergence, I'm not sure what does...well the Hang Seng may win the prize, all of which we saw well over a week ago in FXI posts/updates.

Remember the LEADING quality to the $USD lately in posts I have put up numerous times, which with 4-days down last week was the worst 4-day performance in just about a year, saw a bounce today, again with a leading indication for the broad market, take a look at $USDX futures on a 3C chart.
You may recall the April 2nd $USD forecast for a bounce and then a larger move down, one that may put the $USDX in a primary downtrend as it has made a lower high, next a lower low will be a significant change and put significant pressure on the $9 trillion in $USD-based carry trades, which will in return put significant pressure on risk assets like stocks as Carry trade losses snowball at 100-300x leverage.

The positive divegrence on this 10 min chart of $USDX led to today's positive performance, but note the negative divegrence in to today's gains.

This on the back of EUR weakness (also a former carry trade currency) and $AUD came under pressure after first rising on the PBoC RRR cut, then being talked down by Stephens (another former carry trade favorite currency) who said he wouldn't be surprised to see the $AUD head lower.

Considering the $USD's recent leading of the SPX (consider the forecast for the $USDX-Larger leg down since the bounce was completed), last week's late in the week negative divegrence in the EUR which led to a move lower, forecasts $USD strength as EUR weakness typically translates in to $USD strength, thus another signal from last week of today's oversold bounce (based on market breadth/internals, NOT INDICATORS which can stay at extreme levels for a long time). Thus today's $USD distribution in to the bounce is a negative sign for the stock market following the same logic and relationships that have been in place.

SPX (green) vs. USD (red) and the leading relationship of the $USD.

Today's $USD strength seemed to weigh on the precious metals with GLD-.76% (as we have been recently looking for) and SV down 1.74%. I'll be updating GLD tomorrow.

As for the averages today and their forecasted oversold bounce condition after last week's Chinese margin crackdown, expanded Chinese short salable stocks, Greek Exit headlines and the Comcast/TWC antitrust headlines internals showed the market was due for an oversold bounce which is much more reliable than indicators that seek to prove the same. Tech was the leader with AAPL up over 2% finally making its move above its triangle's apex and on the watchlist, Tech was just behind transports actually, which deserve a bounce.
 The major averages with the NDX in blue at a gain of +1.51% and Transports in salmon with a gain of +1.69% despite oil prices, but you know what I believe we will be seeing near term in USO/oil. Saudi oil production is at a NEW RECORD high.

I'll be updating transports tomorrow as well looking for another entry for those interested as Transports have been a core short position with at least 2 previous entries.

Note after the European close, the averages went flat on the day.

 As for the "Reversal Process" forecasted for last week, looking at the major averages over a week's time, you can see the flat reversal process as there's virtually no movement from the start to the end of the week period covering mostly last week.

Energy over the last week (blue) has led, but as you know, I believe we will see USO weakness and Energy in general (XLE) is another asset I should be covering tomorrow, even though it's much broader than simply the price of oil.

XLF you likely already saw in an earlier post, it's also high on my list.

Yields were modestly helpful to the market today as might be expected

Internals...
Ironically in almost perfect opposition to Friday's oversold condition in P/V relationships and sector performance, today was near the EXACT opposite.

The Dominant Price/Volume Relationship once again hit extremes in all 4 major averages, but unlike Friday's solidly near term (1-day) oversold, today was the most bearish of the 4 relationships, Price Up /Volume Down. There were 21 Dow stocks, 82 of the NDX 100! 1018 of the Russell 2000 and a walloping 316 of the SPX 500 (of 4 possible relationships), this is extremely dominant. 

While I'd normally say this is a 1-day overbought condition, it can also be interpreted as a VERY weak upside move that is failing, we still have that SPX trendline head fake area just above around $2115 which would make for an excellent set of trade set ups as mentioned in Friday's Daily Wrap, especially put positions.

Adding to the argument for a 1-day overbought condition, all 9 of 9 S&P sectors closed green with Tech leading at +1.71% and Consumer Staples lagging at +.35%. 

Also a huge 208 of 238 Morningstar groups closed green. If this is not a 1-day overbought event with a red close tomorrow, it is CERTAINLY a VERY weak trend on any further gains which would suit me just fine if we were to make a head fake move in the SPX!

The overall 3C charts look horrible on this move with no confirmation and steady migration in the intraday timeframes to leading negative, but tI suspect there's a little room for some additional upside.

Ex:
 Not even a 2 min chart could confirm today's oversold bounce! This is not good for the overall market moving forward.

The 3 min looks similar

The 5 min looks perfect for a reversal process and remember, the 15 min chart was the line in the sand...


Since the 4/2 bounce/triangle forecast, 15 min 3C/SPY was in line perfectly then went negative, now leading negative EXACTLY WHAT I WAS LOOKING FOR AND DEPICTING SEVERE WEAKNESS IN THE AVERAGES.

Our leading indicators are looking great as well. The SPX:RUT ratio is severely negative. Pro sentiment indicators are severely leading negative, yields are leading negative, HYG is falling apart as it was notably weak intraday, commodities are taking a turn to the downside and HY Credit has done so already since the reversal process of last week seen above on the week long comp. of the major averages.

I'll take another look at Index futures before turning in, but so far there's nothing special about ES or TF, more or less in line, but NQ/NASDAQ 100 futures are showing some intraday 1 min weakness...
NASDAQ/NQ futures pop on the US open and note the distribution in futures all day, but especially in to the flat area (think VWAP) after the European close (shown above).

I COULD NOT BE HAPPIER WITH THE WAY SIGNALS ARE GOING, THE WAY THE FORECAST HAS PLAYED OUT.

IF WE CAN GET THE SAME KIND OF ACCURACY AND SIGNALS IN THE TRADE ASSETS ON THE WATCHLIST, SEVERAL MENTIONED TONIGHT (GLD, USO, Transports, Tech, AAPL, Financials, Energy), I'LL BE TICKLED PINK!

Again, I'll check the futures before turning in, have a FANTASTIC NIGHT. I hope you can feel the excitement I'm feeling through the post and thank you for all the kind comments/emails re: Friday's Shout Out to Andrea, even if I didn't have time to properly respond (I hate perfunctory responses), know that I read them all and shared many with Andrea. We are so grateful for such an amazing group of people!