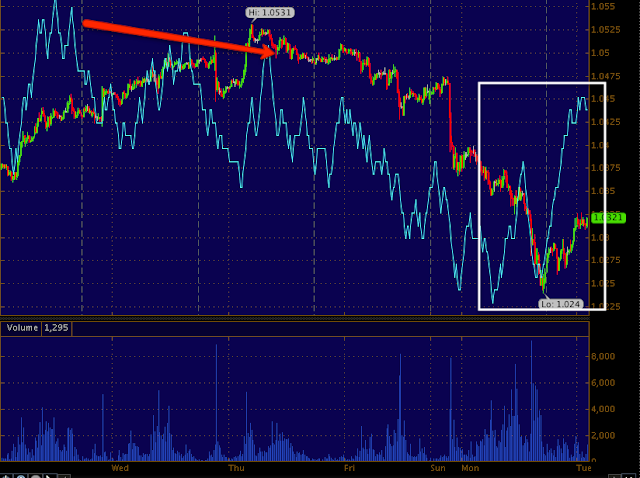
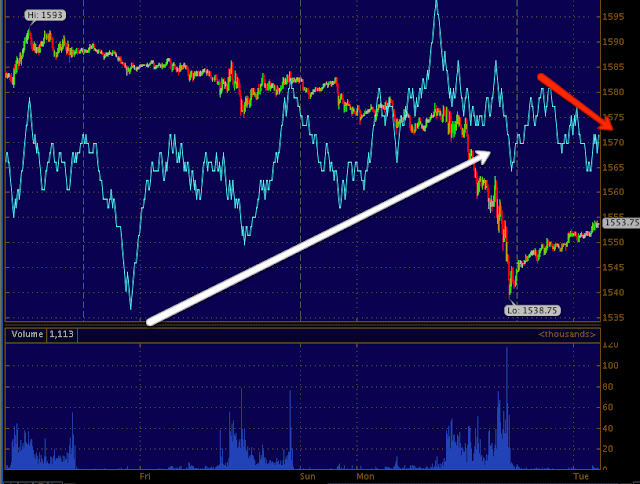
For our currency traders, you should like this one. Given this weekend's post and the important I think currencies play, I think it's important to know what they are doing.
I'm going to add a quick legend with the general relationship between the currency and the market. Then you'll see different timeframes, the longest are the primary trends, the middle are the sub intermediate and the fastest are the short term trends, they all differ and they all seem to confirm our market expectations.
The $AUD Up is supportive of the market/ Down is typically putting downward pressure on the market.
The Euro has the same relationship as the $AUD.
The Yen moving up puts pressure on the market and down is supportive of the market
The $USD has the same relationship as the Yen.
These are the single currency futures only, not FX pairs, but you can get some idea of what they FX pairs will do by the single currency futures.
I'll start with the longer trend first, which is the bigger picture move we expect, the intermediate right now is more transitional leading to the bigger picture and the short term is of course, short term, expectations in the very near term for the market. You will find all of the timeframes represent different trends.
The $AUD
60 min is in line, I don't think the $AUD has determined which way it will go longer term as the RBA (Australian Central Bank) chose to leave policy alone at the last meeting, but is expected to cut at the next meeting and maybe 1 more time this year so there's still a lot of uncertainty there and that shows on this chart.
30 min Has clearly been in a move to the downside
15 min This move is starting to reverse to the upside, short term this is market supportive for a decent move.
5 min is showing increasing momentum to reverse the last swing down to a move to the upside, again short term market supportive as well.
1 min these charts change a lot as they are intraday so overnight it will bounce around a lot, right now it still looks to want to head higher.
EUR
60 min longer term looks like it wants to break down below the $1.30 level, longer term is in line with a broad market move to the downside, at least sub-intermediate in trend, maybe more.
30 min is still leading to the downside
5 min the Euro very short term looks like it wants to bounce, but I wouldn't be surprised if it started to head down before a market bounce was over, the Euro/market correlation has been weak lately, the $AUD has had much better short term correlation.
1 min looks like it will move a bit higher overnight as of now.
$USD
1-Day This is a long term, large bullish base, when currency wars breakout and everyone races to the bottom, the $USD tends to be bought, this is very negative for the market probably out to a primary trend or what is called a bear market.
4 hour The "W" pattern has pulled back recently, but that looks to be ending and a move higher will put pressure on the market.
1 hour also shows the probabilities are high the pullback in the base is ending.
30 min This also supports the pullback is ending, but it looks like a correction to the downside in the shorter term is building.
5 min leading negative, clearly the short term looks like a correction in the larger trend of a move up from the pullback of the last 2-3 weeks or so.
1 min also supports a short term move to the downside or correction, this is short term market supportive as well as commodities and most risk assets incl. precious metals and oil.
Yen
60 min The initial drop from BOJ policy seems to have been under accumulation for an upside reversal ever since the drop ended, there's a rounding base that has started higher, longer term this is a general market negative.
30 min however that move higher, like the USD in some small way, also looks to pullback to the downside short term, this is market positive.
15 min This is confirming and on a timeframe that suggests a decent base and/or move up in the market would be well supported by the Yen as well as the other currencies above.
1 min
Equity Index Futures ES (SPX), NQ (NASDAQ 100), TF (Russell 2000) *ES will be used as the model/example as they are all similar with the R2K looking the weakest.
ES
4 hour The trend in ES is starting to fail, it is going negative long term-at least sub-intermediate to intermediate trend, maybe more.
60 min the leading negative divergence has seen price catch up to it, the divergence worked great (As I showed it Friday morning), we are now at a sort of temporary reversion to the mean
30 min also caught down to the leading negative, reversion to the mean, but slightly more positive as some changes are happening.
15 min starting to lead, ES is trying to put together some accumulation, this is for the "Stage 2" move up I wrote about in the first post of the day Monday morning.
5 min confirms the short term trend, however overnight there's some weakness, this could be VERY MUCH in line with the idea of an intraday or perhaps longer, but intraday is all that is needed, break below the 50-day moving averages in several market averages like the Q's or a break of SPX obvious support nearby.
1 min also went positive after the close and is losing some of that momentum overnight, it gained a bit back, but overall it look like we could see some stop running/head fake moves set up on the downside for a short term move higher.
NQ For short term direction
5 min NQ confirms that the short term is building positive, but overnight there's some weakness coming in, again in line with the downside head fake theory.
1 min gives us a very clear sign of short term intraday weakness setting in overnight, prices should follow, it could turn at the US open, but I doubt it can hold that long.
TF for short term direction
1 min Also confirming overall short term strength, but looks to want to make a head fake move lower where they will likely add to the positive divergences in a meaningful way and the strength of the short term move, as described this morning as "Stage 2".
Is interest rates about to start going up?
-
Yes, I know - it does not make any sense - FED is about to cut
rates...but....real world interest rates are not always what FED wants it
to be.
6 years ago


No comments:
Post a Comment