So far there's been no Yen whack-a-mole tonight, thus futures are pretty tame.
There are only 2 that immediately bring up some question, although I may be missing something very obvious here, the 10 and 30 year US Treasury futures (I'm thinking this is not a legitimate print).
As posted in A.M. observations Monday morning, I wouldn't be surprised for the 10 and 30 year treasuries to pullback, but this doesn't look right for markets that aren't open (underlying market-not futures)
30 year 5 min chart, look to the far right
10 year 5 min, again to the far right
10 year 30 min to give some perspective.
For now I'm going to leave that one alone,
this may just be the roll from December forward.
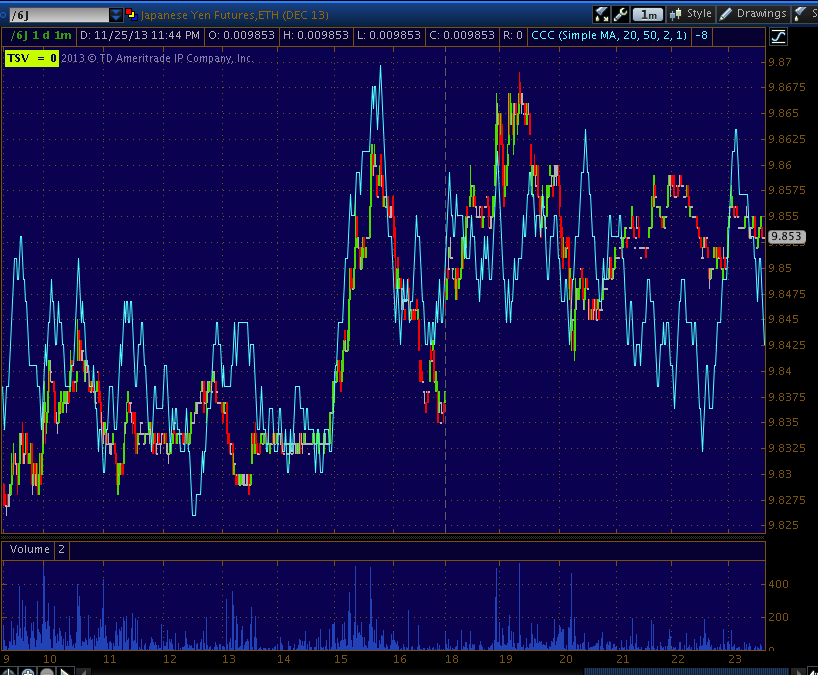
Quiet thus far in the Yen
Yen 1 min overnight thus far to about 12:15 a.m.
However as I have been watching on shorter timeframes, this longer timeframe is similar to some of the shorter ones around 5, 15 min etc. This is the 60 min Yen futures, note the clear channel in yellow trendlines and a downside channel buster, this would be a bullish head fake, (head fake being a broad category for price patterns that appear to be one thing, but in fact are something quite different). A channel buster is one of the more reliable patterns and to think that years ago when I was indoctrinated with Technical Analysis dogma I use to chase these moves and wonder what happened when I was stopped out, "Oh, it must just be one of those times" or "It must be the PPT", in fact it was simply Wall Street taking advantage of the predictability of a century of dogma.
Technical tools are helpful, but they don't give you the excuse to stop thinking. It reminds me of school, the kids that passed tests because they memorized the answers, but they never understood the concepts. I've often said that I think one of the most common traits of those who pursue Technical Analysis is simple laziness. On the other side of the coin, fundamental traders spend days and weeks pouring over earnings, 10Q and less often 10K's's and think that A) they have an edge over multi million dollar research departments with the best information and professional networks (inside information) and B) that the information they have is both timely and accurate.
There use to be a lot of traders (maybe still are) who would buy or sell whatever a hedge funds 10Q said, but they either didn't realize or care that the information could be up to 45 days old and those reported positions could and often were long gone not to mention the end around that allows funds in certain situations the ability to not disclose their holdings if they are accumulating a position (or selling maybe) and disclosure of the position would damage their ability to complete their task, Buffet used this with IBM, I suspect Icahn did the same with AAPL.
Lastly, as this diagram shows...
Tis is Q4 2013 negative pre-announcements in red, vs positive in green and at guidance in blue. The point here is simply the market does not trade on valuations, it rarely has, but certainly doesn't the last 4+ years, the market is more about "Sentiment" than anything else- the Dot.Com era was one of the best examples of this, companies that were =bleeding cash, but had a ".com" after their name were fetching crazy prices and then like the Dutch Tulip Craze, they were no more in the blink of an eye.
Back on point.... I think there's a better than average chance the Yen rallies, if you've read my two articles "Currency Crisis" from April (obviously a little dated) that are linked on the members page, you'll know that I expect a rise in the Yen to accompany a drastic fall in the market.
Gold
This is the 4 hour Gold futures chart, it shows the lower base I thought was possible, it was the lower probability, but still a probability, I didn't mind because a larger base will support a larger/stronger upside trend.
Toy can see the pullback to that base and what looks like a head fake/stop run at the yellow arrows. Perhaps this is why we have been seeing this odd a.m. slam of gold, to get it in position more quickly than it was otherwise moving, again price can be very deceptive.
This is the 15 min chart of gold, note the strong and unusual 3C activity in gold today, this was seen in GLD and GDX (NUGT and DUST as well), I wrote several posts about it Monday afternoon and added to both GLD and GDX December Calls.
It's impressive for a 15 min chart to move like that in a day as far as the size of the divergence and the vertical nature of the divergence with almost no zig-zags, but a 30 min chart to move that big that fast,
that's unusual and unusual signals are typically the ones that give us the greatest edge; it's like catching them with their hand in the cookie jar except we are quietly slipping behind and grabbing some cookies too.
The Gold 60 min futures chart
The 15 min VIX futures helped me to call some weakness last week, it was right on, now that chart is clearly transitioned to a positive stance.
Just seeing this and knowing what Spot Vix's B's look like is encouraging, but to see short term VIX futures also throwing very strong signals since Friday really rounds things out.
Nikkei 225 Futures
The 5 min chart looks like the Nikkei could see some upward movement for a bit, perhaps intraday, but the slightly larger picture paints a different beast altogether.
15 min Nikkei 225 futures with 2 accumulation zones and 1 large distribution zone.
Finally the Index futures tonight, just checking again as some time has passed since these were captured... ES has barely moved, 1802 print at 4 p.m. and 1802.25 right now. I'm not interested in 1 min charts overnight, it'd too long, too much can happen, I'm interested in 5 min and above charts, they hold up and can provide useful information.
ES 5 min, just like the 1-day positive last week was used in our analysis and was dead on correct, I have no reason to believe this larger 5 min negative isn't also correct.
In fact on a 15 min chart we can see that 1-day's accumulation and the price move off that accumulation and with that one chart alone,
you can learn more about how smart money operates (accumulates/buys and distributes/sells) than in years of switching to the newest, hottest technical indicators.
Ironically, this is one of the most misunderstood processes in all of Technical Analysis
which allows Wall St. to use Technical Analysis against traders, I frequently wonder why traders haven't adapted after 13-14 years of being manipulated (it didn't really start until cheap online brokers became the rage and all these newly created portfolio managers needed a quick way to analyze the market, TA was much faster than fundamental analysis), I find the answer to be the same as the attraction to Technical Analysis, pure laziness; it's so much easier to watch two moving averages cross each other .
NQ 5 min, note the tell-tale tight range and why?
Think of today's range...
We often see distribution in these tight ranges after an uptrend, at a bottom we see accumulation.
This chart (1 min) of ES today shows VWAP, note price can't break above, it's very likely the reason why, is sellers like market makers and specialists who are paid on their performance filling an order are filling at VWAP as VWAP is the standard metric of their performance.
Once VWAP is lost, price falls fast.
Now look at the 3C chart of the SPY today.
The concept I talk about often of 3C signals at the end of day picking up where they left off the next trading day, even if it's after a weekend, is on display here as a gap up iis promptly sold from a negative divegrence continuing from Friday afternoon.
This concept is seen often and this is just a good example as any.
At #1 there's resistance at VWAP which is around the red trendline, from looking at ES's VWAP it looks like sellers were at work, 3C distribution/negative divegrence tells us the same thing. When price moved above VWAP at #2 that's a better fill and it appears a lot of shares were filled there until there was no more support as 3C continues lower, price loses VWAP and quickly declines below the lower channel.
The 3 charts taken together tell you more about how price is filled, the condition of the market, how market makers and specialists work and more, they are 3 valuable charts of the same moment in time, all confirming each other.
The Russell 200 5 min chart negative divgernce.
And the 15 min chart. Compare the accumulation area vs the distribution area in terms of size and intensity. I'd interpret this as some light accumulation to send prices higher where larger distribution takes place filling at a profit or at the best fill they can get, this is why we watch intraday charts, initially just to see what market makers and specialists were doing, now apparently HFTs are in the mmix as well.
Have a good night if you are still up, I'll see you in a few hours.


No comments:
Post a Comment