I think the thing that stands out the most is the number of gainers. For +5% gainers and -5% losers, the number was quite strong with 303 5+% gainers including our NUGT position today. The -5% losers came in at 47 (and likely many of those were leveraged inverse ETFs).
There was no dominant price volume relationship, but for all NYSE stocks, gainers came in at 5523 and decliners at 1190 a 4.6 : 1 ratio.
For the Dow 27 advances, 2 declines and 1 unchanged.
The NASDAQ 100 saw 93 advancers and and only 7 decliners!
The S&P-500 448 gainers vs 51 decliners and 1 unchanged-a nearly 9:1 ratio which is a better measure of the market considering the NYSE composite includes inverse ETFs whereas the S&P-500 does not.
The Russell 2000 came in with 1671 gainers vs 181 decliners.
As for the charts...
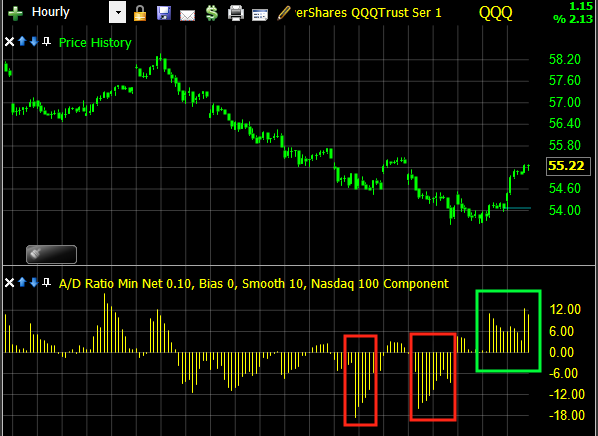
Breadth
The hourly NASDAQ 100 Advance / Decline Ratio spiked 2x last week, we also had two days of dominant price volume relationships that suggested a short term bottom by way of capitulation. Today's A/D line looks good as you'd expect from the internals I mentioned above.
The % of stocks moving above their 60 min 50 bar moving average is also quite strong, with 80% now above the hourly 50-bar average.
It is important though to keep the big picture in mind, and this daily chart of breadth for the NASDAQ 100 shows you were things went badly wrong at the new highs in May.
As for today's trade...
This is the SPY 10 min Bollinger Bands. It's extremely bullish when an average walks the upper band as we saw here until about 11 a.m. as we approached a resistance level. The longer the chart time frame, the more important this behavior of walking the bands is. Conversely walking the lower band is extremely bearish for an index. I think this chart simply points out the importance of today's resistance zone.
This chart shows volume by price and once again, you can see sell-side volume had a much higher ratio to buy side volume around the resistance level.
Finally, as you saw all day with 3C, TSV 55 on a 5 min chart shows the same action 3C was showing and once again the resistance level and the subsequent test of that level saw distribution.
As to tonight's major event, the Greek confidence vote...
Panpandreou won the vote at 155 to 145, a pretty much straight party vote as his party controlled (I believe) 153 seats after two defections.
The Euro's reaction thus far (which I think we should consider to be knee-jerk) has been to sell the Euro sending the $USD higher. It's not yet a bloodbath or anything like that, more of a sell the news event. However, if this keeps up overnight, the dollar should strengthen and the inverse correlations like equities, could see some downside selling pressure, which would be roughly in line of a pullback that seems to be in order before the average try to move through today's resistance.
Here's' the EUR/USD pair as of 6:30
The Green arrow is where FX opened the week and the red box is the reaction to the vote.
In after hours trade, the market is down marginally, silver is up marginally and GLD is just a bit above unchanged.
I don't like reading too much into knee jerk reactions and will check the FX pairs in a few hours to see what sentiment is looking like.
I'm sure I'll most likely have a follow up post tonight, watching for any obvious changes in sentiment.


No comments:
Post a Comment