The entre premise of the last month's action (rally included and the breaking of the back of the rally) all centered on two key concepts, 1) the market is going to always seek to make as many people as possible wrong at any one time which we saw with the short squeeze rally and 2) the strength of the 30-60 min 3C charts in a market that showed little strength otherwise. That's why I'm happy to see things have worked out as planned and the DIA 60 min chart has fallen in to a leading negative divergence so quickly, establishing the proof of the second part of the trade, "What should happen after the rally?" As you know, I felt there was a high probability a long trap would be set and as the DIA moved higher, you can see 3C showing distribution into that move.
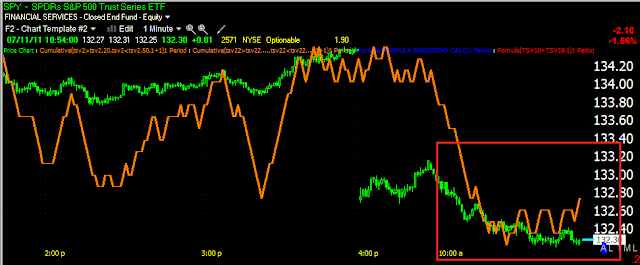
Right now the 1 min chart of the DIA, just like the SPT, QQQ and IWM - is in line with trade, but....
The 5 min chart is still in a relative positive divergence suggesting we will see an intraday bounce today, which provides you an opportunity to short any stocks/ETFs you may like, in to strength, which reduces your overall trade risk and gives you better positioning.
The IWM 60 min chart breaking down as well, after it showed good confirmation of the early uptrend/rally
The 1 min chart in line on the IWM, but...
a 5 min relative positive divergence is found here as well, like all of the others.
The QQQ hourly 3C chart going from strength/confirmation, to weakness/divergence, this is exactly what I wanted to see.
The QQQ 30 min chart doing the same-remember, it was strength in the 30-60 min charts that made me believe we would see the market bounce we saw.
1 min QQQ chart in confirmation of price
And the 5 min chart suggesting again we will see some strength build in to the market some time, likely today.
Here's a longer view of the underlying strength in the SPY 60 min chart, while the market was weak, suggesting the bounce. Then 3C confirmed the bounce making higher highs with price, now it's gone negative.
The same can be seen on the 30 min chart.
Like all of the others, 1 min confirmation, but...
a 5 min positive relative divergence.
Is interest rates about to start going up?
-
Yes, I know - it does not make any sense - FED is about to cut
rates...but....real world interest rates are not always what FED wants it
to be.
6 years ago


No comments:
Post a Comment