On Friday I posted a very short update on SLV
I said, " I've seen this pattern a lot and usually it's a good indication of a downside reversal."
A so far this morning, the warning was spot on with SLV down nearly -2.25%
The price/3C pattern in the red box is what I was referring to, SLV has slipped on heavy volume since.
The hourly chart still shows some strength, but is starting to turn ambiguous.
The weakness in the 15 min chart (the first chart above) and this 10-min hart may spread to the longer term charts and reveal more trouble ahead for silver. Friday of this week, the Dodd/Frank legislation goes in to effect, many OTC trades in gold and silver will have to be closed this week so I expect some unusual volatility. We don't really have a recent historical model to guide us with regard to how the closing of the majority of the OTC gold and silver markets will effect the metals. This legislation seems as if it will effect hedge funds as well and there could be some huge positions that are shut down there, I imagine they may be reopened in the regulated markets, which would target GLD and SLV specifically. However, the key word is "regulated" where the trades in gold and silver will fall under COMEX margin rules. It will be interesting to say the least.
The long term daily chart of SLV is not bullish and if the price action n the red box turns out to be a head fake/false breakout, we could see some rather swift downside.
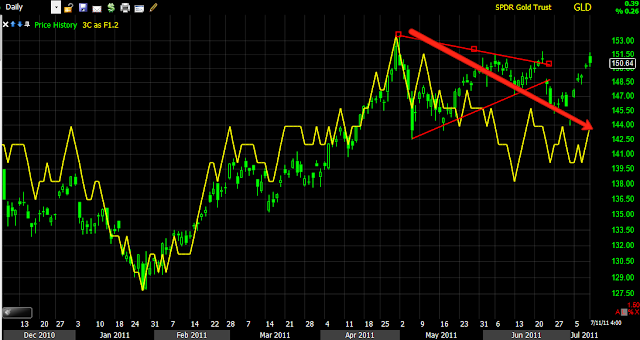
GLD- My thoughts on gold are pretty well known by members, I view this daily chart below as a bearish formation which in turn, may give rise to a pullback to the long term mean, which can be found at the 150-day moving average for GLD. In the case of a pullback to the 150 m.a. which only happens 1-2x a year (from recent historical data), this may indeed turn out to be an excellent long term buy signal. This may in fact be what the OTC gold traders will look for as they are forced out of the heavily leveraged OT markets, with less leverage, they may be looking to buy gold at a discount to make up for the loss of leverage. Also (even though out miners trading signal is currently bearish being long DUST), there seems to be a longer term base forming in the gold mining stocks which are also a great bargain relative to the price of gold.
At least 1 false breakout in the GLD triangle can be seen at the first white box, sending GLD lower. This second breakout also appears to be a false breakout.
Here's the daily 3C chart for GLD, it is a bearish topping pattern and suggests that GLD will pullback.
Is interest rates about to start going up?
-
Yes, I know - it does not make any sense - FED is about to cut
rates...but....real world interest rates are not always what FED wants it
to be.
6 years ago


No comments:
Post a Comment