ES is below today's intraday lows right now.

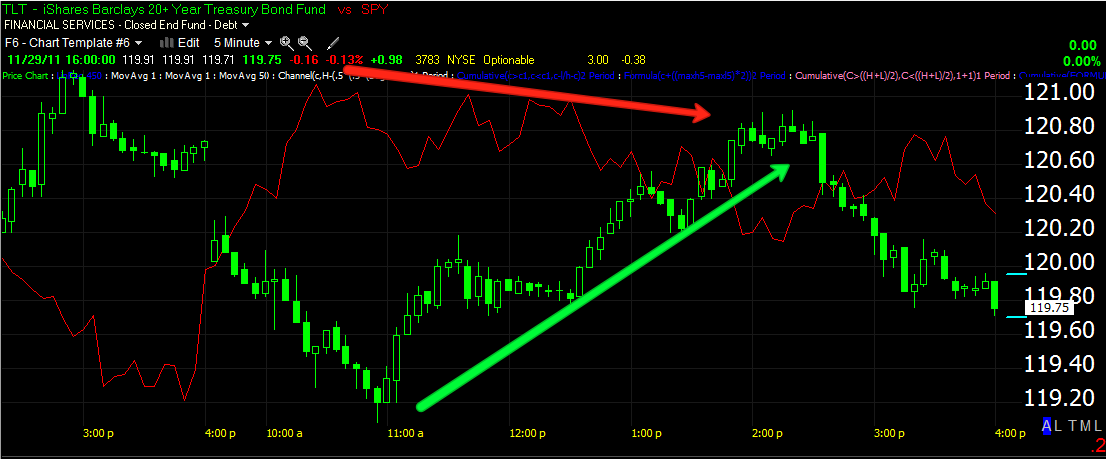
Interestingly, Treasuries (which usually trade inversely to the market and are a safe haven trade against an equity market decline) performed better today (not as well as yesterday) then their correlations would imply, suggesting that smart money is using this opportunity of the last 2 days to move in to the safety of treasuries.


In contrast...


Back to the event of the night, the S&P downgrade of major American Financials...
S&P reviewed 37 of the largest banks and financial institutions, BAC for example was cut from A to A-
The full list of downgrades which includes subsidiaries is so large that I think few members would be interested in reading the entire document.
Here's a link to Forbes that covers the story.
Among the majors downgraded: Bank of America, Goldman Sachs, Citi, Morgan Stanley, Wells Fargo, JPM Chase, Bank of New York Mellon, Barclay's (another on our short list), HSBC, Lloyds, Royal Bank of Scotland (recall earlier today that Goldman's Sigma X showed several of these banks trading down substantially-leaked information I'm sure), UBS and this is just the start.
As this Forbes article makes clear, more are on the way
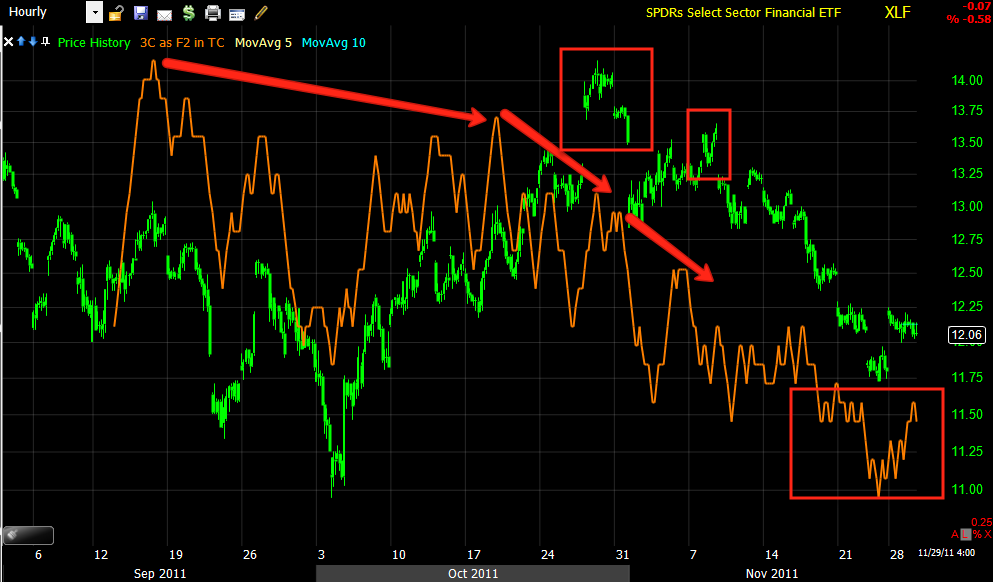
Here's the full list in PDF format for those interested, but I think we were right on target in transitioning from directional trades to stock picking and starting with the financial sector, clearly today's rating action vindicates the view 3C has been showing toward financials.
As far as I can tell, most downgrades were 1 notch, however subsidiaries of each bank were considered separately under S&P's new November ratings guidelines. It seems every BAC subsidiary was downgraded by 1 notch, from a quick look, the same was applied to Citi's multiple subsidiaries, I assume the theme is the same for most of the majors that were downgraded.
Again from a quick browse, banks all over the world were hit including South America, Australia and New Zealand. In some cases it seems some banks were left unchanged, but subsidiaries were downgraded. Several high profile European banks remained unchanged.
What really stood out was the number of major US banks that were downgraded.
The practical effect of the downgrades is not just equity valuations, these banks that are already struggling with weak economies and the accelerating pace of the EU's crisis may have to post billions of dollars of collateral and termination payments, adverse liquidity effects, potential loss of access to credit markets, higher costs of borrowing, and counter-party credit problems with regard to trades and interbank liquidity. So this isn't just a simple downgrade, the downstream effects could tip an already fragile banking sector over the edge and the new Dodd-Frank regulations make financial institution bailouts that much more difficult. Again, we are at the edge of the second shoe dropping, but in far worse condition to deal with the fall out.
A few real world examples:
Morgan Stanley estimated over-the-counter derivatives counterparties could demand $1.29 billion of collateral or termination payments from the New York-based firm after a one- notch downgrade. In addition, the firm may have to post an additional $323 million to exchanges and clearinghouses. All the estimates were as of Sept. 30.
JPMorgan, the largest and most profitable U.S. lender (BKX), has said the New York-based company may have to post an extra $1.5 billion in collateral against its derivatives and pay additional sums for contract terminations after a one-notch cut. In retrospect, it's little wonder that the credit/risk assets indicators remained so weak over the last two days.


No comments:
Post a Comment