Every EIA report day we have a number of trader who day trade USO as we seem to get some great signals on likely report leaks, remember from the earlier post that USO was negative on this a.m.'s gap up. In any case, this update is for both longer term position traders and those of you day trading USO.
So here's the bear flag, it did break, intraday we often see volatility shakeouts on these breaks so if you were in early and using leverage, you probably have a decent profit that you'll be looking to protect.
Here's the intraday break from a gap up which was negative since yesterday on the short term charts, long term charts are just plain ugly and this post doesn't apply so much to position traders other then the initial bear flag break is starting the next leg down.
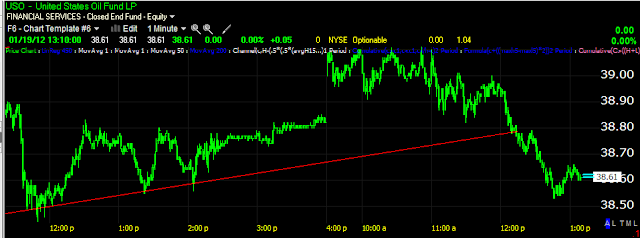
Here is the 1 min chart zoomed in close, so intraday thus far there's nearly perfect confirmation of the trend, the negative divergence from the open is visible to the left.
When the 1 min chart is scaled out to where it belongs, you can see the 1 min is actually leading negative, for swing traders this is a good sign.
On a swing trade basis, you'll want to allow some room for any volatility since the flag was broken, the Trend Channel was also broken at the red line, the white area is a potential initial stop for swing traders.
If you are running a leveraged day trade, then you don't want to get caught in any volatility moves and I would use this tighter stop (white trendline) as you probably already have well over double digit profits on puts.
Is interest rates about to start going up?
-
Yes, I know - it does not make any sense - FED is about to cut
rates...but....real world interest rates are not always what FED wants it
to be.
6 years ago


No comments:
Post a Comment