I've heard from quite a few members since yesterday that made a nice profit on a quick trade yesterday using puts in AMZN and are now looking for the next set up. I'm really happy to hear not only of the profits, but more importantly that they used the updates to put on trades that fit with their own style. Or in other words, I'm proud that members are out fishing on their own. While I try to provide updates and ideas, more importantly I want to provide the concepts that help members enhance their own trading, that is what makes me most proud and when I hear those stories, it really energizes me.
OK, on to AMZN...
This is the suspected head fake move above resistance and more importantly above a centennial mark/even number of $200 which the human mind gravitates toward. I'd like to know how many traders placed limit buy orders right at $200, I bet a lot. On the daily chart we have the strong breakout candle followed the next day by not only ZERO follow through buying, but a bearish Shooting Star reversal candle. Yesterday the 3 candle reversal of a "shooting star reversal" was confirmed with a bearish engulfing candle that closed near the lows, but found support at... You guessed it, the $200 area. This is short term and probably pretty decent support, although the breakout/head fake confirmation level is a bit lower defined by former resistance.

Here are the levels on a 60 min chart, $200 where AMZN found support yesterday and $196.70 which is the breakout level. A move below $196.70 confirms the head fake move and puts a lot of longs at a loss, which in turn creates the snowball effect summed up in the saying, "From failed moves come fast moves".
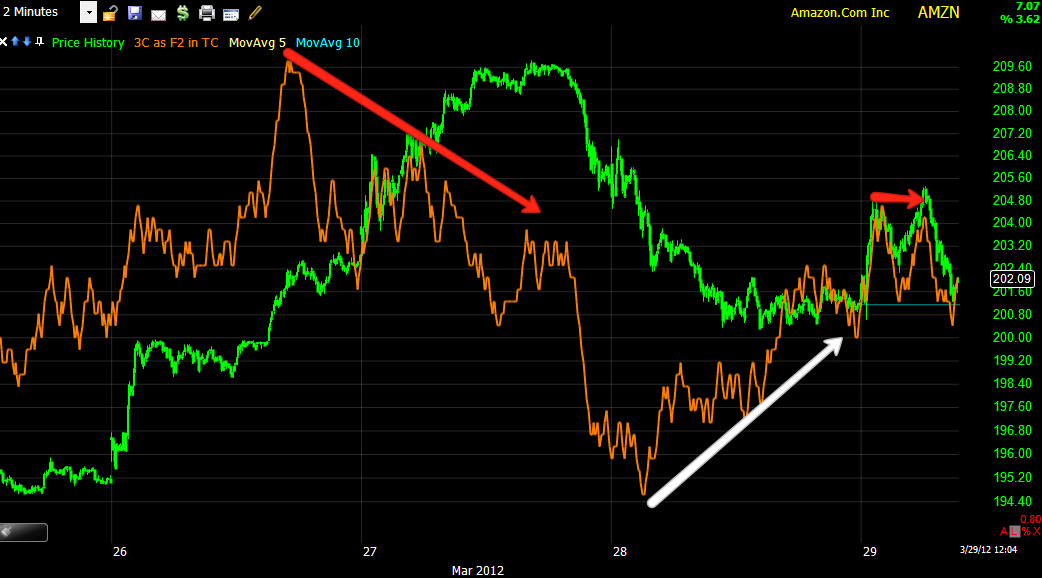
On the short term 2 min chart, there's the same positive divergence most of the market saw yesterday, this was enough to keep AMZN from breaking $200 and may provide some intraday lift. The ideal scenario for entering AMZN again would be a bounce off short term support in to a negative divergence that starts to turn down and a close below $200, the deeper the better.
The 5 min chart shows again the same positive divergence that went in to a relative negative at AMZN's highs yesterday. The yellow square is an unknown at this point, whether it provides another 5 min positive divergence or whether it just hasn't caught up yet and moves lower.
Here's the longer term 15 min chart relative negative divergence which played a part in turning AMZN down from it's local highs, that chart saw some damage yesterday in a leading negative divergence.
Again on a 60 min chart, AMZN saw a larger relative negative divergence at the recent highs and even the 60 min has some leading negative action which usually take a lot longer to reach this time frame.
On a daily basis, Money Stream confirmed AMZN's move higher through 2010/2011 and went negative at the 201 highs, since then it has gone leading negative, this is the long term trend deteriorating badly.
Another mark of danger for AMZN is a break of the daily Trend Channel which held the move down in late 2011 and has held the March move up, a break below what will probably be around the $195 area will be a different trade altogether and more of a trending trade.
So we'll be watching for any intraday strength in to negative underlying action to short in to, otherwise, a break below the two levels I mentioned earlier in another play that can be considered. I would also make a note of the long term trend and the Trend Channel's stop as this would be another trade entirely and more of a trending trade.


No comments:
Post a Comment