Lets dig right in...
Today's price action came on mixed average volume (NYSE 817 mln, vs. 805 mln avg; Nasdaq 1710 mln, vs. 1726 mln avg)
Decliners outpaced advancers in both the NYSE and NASDAQ (NYSE 1016
/2014 Nasdaq 861
/1664).
This is close to the kind of action that can produce a 1 day oversold condition, but not like what we saw earlier in the week (creating a 1 day overbought condition) and last week when the ratio was closer to 3:1.
As far as the other indication of 1 day oversold/overbought, the dominant Price/Volume relationships; of the four main averages, only 2 were dominant, the Dow and SPX.
Both the Dow and S&P saw a dominant Price/Volume relationship of Close Down and Volume up. You may recall yesterday's Dominant relationship was Close Down/Volume down which told us that the market was not oversold on a 1 day basis and we saw lower prices today. However while only 2 averages are dominant, they would suggest a short term oversold condition is in effect (this is usually only a 1 day or less effect).
What is interesting is the total number of decliners in the SPX, both volume up and down, it's about 80% of the SPX.
Amongst commodities, the metals are interesting.
Aluminum (ALUM) posted its lowest close in about 2 months on exceptional volume. Remember, when important support is broken we often see an upside volatility shakeout, unlike the days of old in which the market may fall, tag resistance and continue lower, it is much more volatile now, but this clearly is not a good sign and probably is reflecting China's slowing economy.
Copper seen here vs the SPX has fallen out of favor after rallying with the market for 4 moths, today COPX broke support as well going back nearly 3 months. The divergence with the SPX is clear.
GLD which was a short term long call last week, seen here under accumulation with a shakeout/head fake move on the 22nd just before GLD ran up, posted its largest 1 day advance in two months on Monday and posted its largest two week decline today, you can see the 3C negative divergence sending GLD lower.
On a slightly longer chart you can see the top/negativ 3C divergence, however today GLD found some support about where I thought it might around the gap of the 26th and 3C shows a small positive divergence, I think GLD can post some additional gains from here, although the call from last week was clearly for a short term move. GLD remains the only metal still green on the week despite today's decline.
SLV also was a long call from last week on the positive divergence to the left, both GLD and SLV saw a shakeout just before they moved higher. Today there was also a small positive divergence in SLV suggesting some more upside short term.
Last week was also a short term long call on the miners, I favored the Juniors over GDX, GDX ran a bit, went negative and today also posted a small positive divergence.
I like how the juniors loo better (GDXJ), there seems to be a larger accumulation period, this one also saw a shakeout before running up and is posting a 5 min leading positive divergence today, so I'd expect another attempt at a leg higher.
While we are on commodities, lets take a look at USO...
Here's today's EIA petroleum report...
|
Released On 3/28/2012 10:30:00 AM For wk3/23, 2012
|
|
|
Prior
|
Actual
|
|
Crude oil inventories (weekly change)
|
-1.2 M barrels
|
7.1 M barrels
|
|
Gasoline (weekly change)
|
-1.2 M barrels
|
-3.5 M barrels
|
|
Distillates (weekly change)
|
1.8 M barrels
|
-0.7 M barrels
|
|
As you can see there was a huge build in crude inventories with a draw in gas and distillates, this kept USO under pressure today.
The EIA report seems to be one of the most leaked reports we see and this negative divergence on the 27th which is severe may very well have been a leak of the report. Intraday USO saw a minor positive divergence and some end of day upside.
The longer term hourly 3C chart looks bearish to me, but I think USO will remain choppy within this declining range with probably a few opportunities to pull off some quick trades with options for addd leverage.
XLB-Materials broke under the 50 day on some volume today, the trend there obviously not very bullish, but once again, breaks of important support often lead to volatility shakeouts so don't let short term noise fool you.
Last year we identified weakness in China weeks before their PMI confirmed it by the weakness in commodities, so lets move on to China.
FXP came out of the bullish descending wedge and did what all descending wedges do, travelled laterally building a base, we have had a couple of well timed long trades here and I'm looking for another as FXP is at a resistance level, I'd like to see a pullback to the 10-day m.a. to look at buying for the next trade.
The long term 60 min chart is leading positive and looks very strong, although I'd rather trade FXP then hold it.
Today we saw a negative divergence in FXP pushing it off its highs, but there's already the start of a positive divergence, if the market bounces tomorrow as I suspect, that may be what we need to push FXP to the 10-day and as long as the positive divergence builds, I'd look at being a buyer, we do have China's Flash PMI Sunday night to keep in mind.
As for the market averages...
The DIA 1 min shows the negative divergences that we saw on the recent price strength, they were persistent and led the market lower, today in the afternoon we saw positive divergence on the short term charts suggesting a bounce tomorrow, whether it is all day or early I don't know yet, so long as ES hold up overnight, I would expect a bounce. The 1 min showed a little weakness in 3C going in to the close, it may just have been nervous profit taking by day traders.
A little longer term 2 min shows the negative divergence through the redent price strength this week, actually lading negative before the fall, again we see this afternoon's positive divergence form at the intraday lows.
The longer term trend on the 15 min remains in a leading negative area, suggesting as I said during the strength this week, that the strength in price was likely being sold in to. This longer term trend trumps the positive divergences on the short term charts.
The QQQ saw a very negative divergence in to this week's price strength, leading negative. Again today we see an afternoon positive divergence suggesting a bounce starting tomorrow, how long it will hold I can't say until we see the 3C reading tomorrow.
Here's the bigger picture of the same chart above, the QQQ remains in a leading negative trend, note how negative it was during this week's bounce.
And the longer term trend is still leading negative, again suggesting price strength is being sold in to.
The short term SPY chart showing the negative divergences in to price strength sending the SPY lower and today's positive divergence. However remember that the longer trend of these charts is still leading negative as the move up was never confirmed in any of the averages.
Here's what I'm talking about, note the relative negative divergence from the 15th until now, confirmation would see 3C near price, instead it remains leading negative. So any bounces I view skeptically and will be looking for opportunities in some leveraged inverse ETFs and other short positions we have been monitoring. Maybe a couple of our long pick will pop on a bounce?
The 5 min chart going negative at the highs of the recent mov up and today' positive divergence.
On the SPY 15 min chart, representing the bigger trend, look how much damage has been done recently with the 15 min leading negative the last two days. The long red arrows show longer term negative relative divergences, compare where price and 3C were at the start of the arrow vs the price highs.
Emerging Markets...
EEM -Emerging markets broke its 50 day today, I'd like to see the March lows taken out within the next week or so.
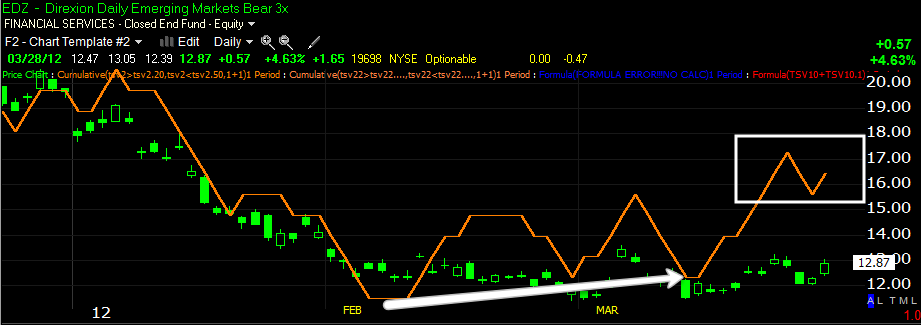
Looking at the leveraged inverse ETF for EM, EDZ, the daily chart is showing a strong positive divergence that is starting to lead, this is the larger trend, it seems EDZ has built a solid base.
Compare that to EEM, Emerging Markets on the daily and it's nearly the mirror opposite, with a negative divergence that is starting to lead, this is confirmation between EM and EM short ETFs.
As for our Risk/Credit/FX indicators...
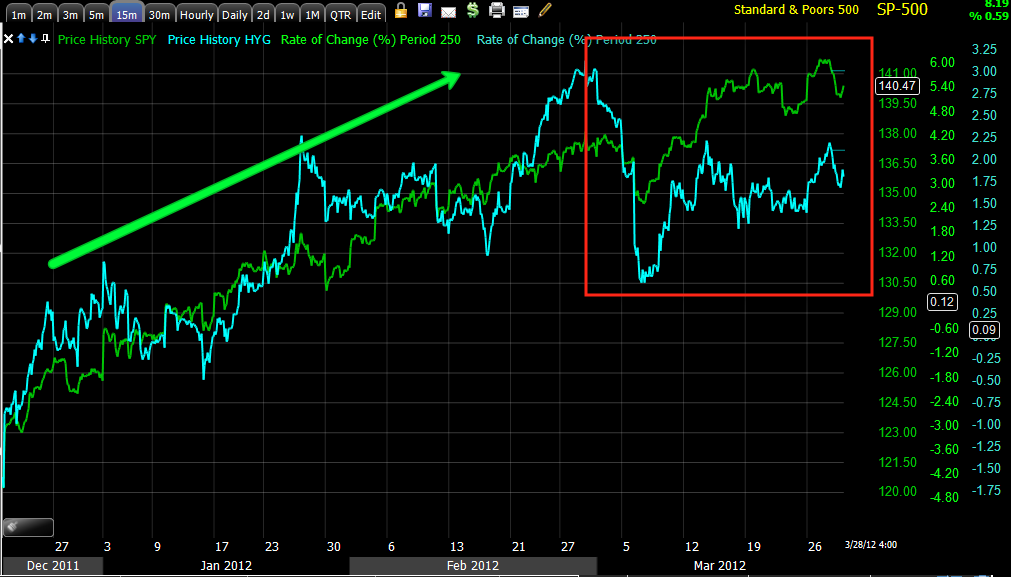
These are all compared to the SPX in green. Commodities were giving a red flag on the 20/21st as they diverged away from the SPX leading to a big gap down, commodities actually gave a positive signal before the SPX bottomed at the white arrow for this weeks ramp up, you can see where commodities diverged again away from the SPX and the market headed lower. Long term commodities are significantly dislocated from the market which is noot a healthy rally when a risk asset group like commodities are so dislocated, this would suggest a reversion to the mean is coming.
High Yield Credit should rally and even lead the market, here you can see HY Credit hasn't made a higher high since Feb. 6th and in fact is trending down.
Yields have been an excellent leading indicator, you can see tow places where thy diverged from the market and what happened after with the market dropping.
On a very short term intraday basis, Yields are positively leading and that confirms what w saw in 3C today in the afternoon in the market averages. This too suggests a bounce if ES can hold up through the European open. I covered the EU close earlier today, not pretty, check out the post. However as we move closer to Friday/Saturday, more leaks about the EFSF/ESM combo will come out and likely ramo the market short term, even though everyone already knows what they intend to do and that both bailout mechanisms are broke.
Here's a long term daily chart of yields, note they deteriorated badly in 2011 leading to the late July 20% decline, look how dislocated they are now long term.
The $AUD has been an excellent leading indicator lately, it calle gaps down the day before last week, at called the move up as it was moving up while the SPX was still searching for a bottom and recently they called the top in the move up.
Here's the rally's trend and the $AUD diverging away from the SPX, even though it had earlier confirmed the rally, it is now negatively divergent. This is quite a divergence and is certainly reflecting the unwinding of the carry trade.
High Yield Corporate Credit was also in sync with the rally and has recently fell out of bed, remember, Credit leads, equities follow.
This is financial momentum vs the SPX, clearly financials came to the rescue in the afternoon today and were the only of the 10 major industry groups to close green +0.25% today.
As far as sector rotation, it makes perfect sense for the most part. Early in the day, the relative performance was skewed toward defensive groups like Utilities, Healthcare and Staples; that faded in the afternoon as Financials came in to rotation. Energy, Basic Materials, Industrials and Discretionary remained notably out of rotation even later in the dy. Tech held its ground thanks to AAPL.
As for ES as of right now...
You can see the positive divergence during market hours at the lows about the same time as the market averages and ES made it back to its VWAP by the New York close. Since then there have been a series of positive and negative divergences. ES closed at 4 p.m. at $1400.50 and is now at $1398.75 so its relatively flat overnight, but Europe opens in a few hours.
Have a great day tomorrow (today), hopefully we'll find some nice opportunities.


No comments:
Post a Comment