DIA 1 min shows yesterday's short term positive divergence and a slight negative divergence toward the end of day, this seems to be right on track with the gap down this a.m. This a.m. we see the start of a positive divergence and a slightly leading component in the white box.
Longer term DIA 1 min from the negative divergence at the recent top, the first white arrow is yesterday's positive divergence, the second white arrow is today's, the green arrow shows a positive relative divergence between the two days lows.
DIA 2 min shows a positive divergence
Either it's not strong enough to make it to the 5 min chart or just too early, but there's only a less powerful relative positive divergence here. The longer the timeframe, the more meaningful the divergence.
QQQ 1 min showing yesterday's positive and a small negative at the EOD which makes sense with the gap down this am, again the green arrow denotes a relative positive divergence between the two days.
QQQ 2 min showing positive divergences and a slight leading component today.
The 5 min only shows yesterday's divergence, for this reason, I'd say the Q's positive divergence looks to be the weakest thus far.
SPY 1 min positive yesterday with the EOD negative like the others and a relative positive divergence between yesterday and today.
The longer view of the same timeframe, even though there's a positive divergence, the trend of 3C is still very negative, so I view this as a small divergence thus far.
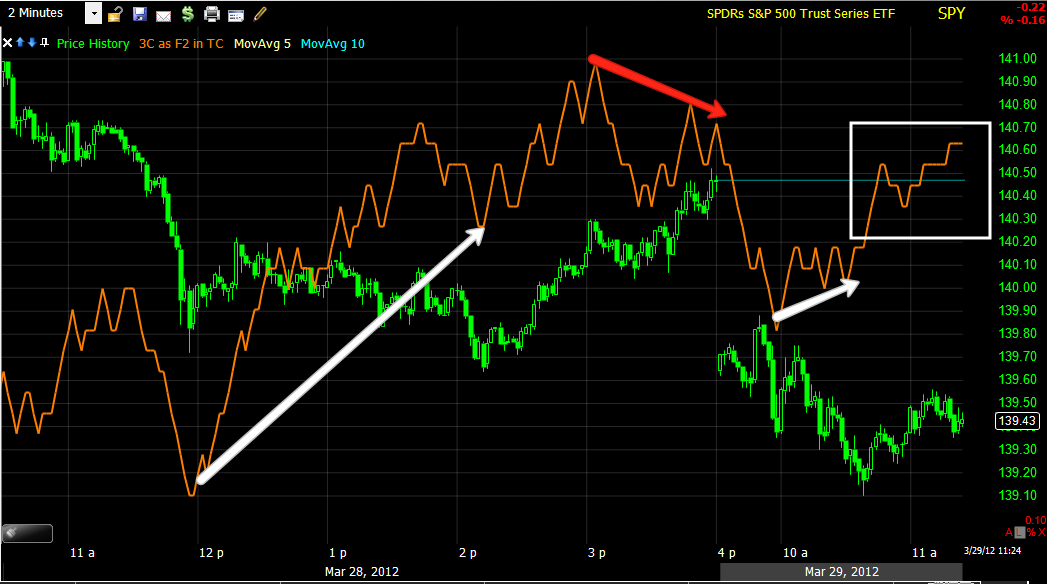
SPY 2 min w/ yesterday's positive, turning negative at the end of day and a positive this a.m. with a slightly leading positive component.
This is the same chart, I'm just pointing out the relative positive divergence at the bottom arrow between the 2 days.
SPY 5 min with a positive divergence between the 2 days.
ES is not showing any positive divergence, it is in line with price


 | Theme by Thur
No comments:
Post a Comment