This is a shorter term update, there's still the issue of a possible gold top, whether it be a primary top or a lesser intermediate top, that will be addressed in a more intensive post later.
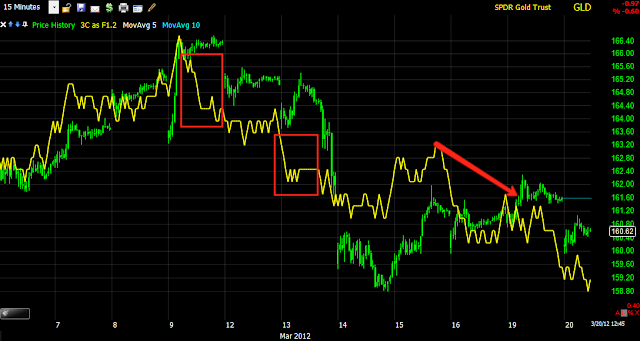
Here's the 15 min chart on a GLD bounce attempt after the larger head fake move. There's not much positive on this chart.
However on the shorter term charts (remember, divergences have to start somewhere and they are usually on the short term and migrate to longer term charts as they become more powerful or if they become more powerful). What we have here is a positive divergence on the 14th sending GLD higher and a leading positive position for 3C since, even on today's drop in GLD, the 5 min chart is still even more positive, suggesting the dip is being accumulated.
Here's a 1 min chart with the details of the dip, you can see the positive divergence from the 14th on the left and except for 1 negative divergence which sent GLD lower, GLD has been in line or trend confirmation here. Today you can even see a leading positive divergence on today's gap down, again I suspect there's some accumulation of the weakness.
The 150 day moving average has been the most relevant average for GLD, from what I see now, I wouldn't be surprised to see a short term move above the 150 day average, again this is the shakeout theory at work as the 150 was recently broken again. Thus far it looks like a short term long trade, but again, we still have the bigger issue of the probable GLD top to deal with. In the mean time, you might want to take a look at GLD for a quick trade, our last one was a 215% move using some calls and lasted about 3 days.


No comments:
Post a Comment