Longer term, commodities have been lagging since before the 6th of March and lagging in this current leg.
The EUR/USD seems to have very little influence today, normally it is pretty closely correlated to the market, the red line is yesterday's close at 4 p.m., you can see a little bounce in the Euro, theoretically this should help the market a bit to bounce intraday, maybe try to fill some gaps.
The carry trade pair of AUD/USD has sold off since the close and this is what the market seems to be following more closely as the carry trade is unwound, that isn't good for stocks or any risk asset for that matter.
Intraday this is the Euro vs the SPX, the Euro is leading the SPX
Intraday this is the $AUD carry currency vs the SPX, it is much more in line with the market and slightly lagging the market. I think there are two currencies pushing and pulling on the market, the Euro on the upside and the $AUD on the downside.
The $USD seen here in green vs. GLD saw a stronger opening, pressuring the PM's, it is now moving back toward yesterday's flat range, the $USD would normally have the greatest influence on the market algos, however it seems the $AUD/$USD pair is exerting more influence lately.
Financials are the strongest on the day thus far, leading the SPX.
Tech had an initial strong open, that has since faded.
Sector rotation from yesterday afternoon to today shows Financials coming back with good relative strength, however the defensive sectors are also coming back in to rotation, Utilities, Staples, (earlier Healthcare). You can see Energy is off today as is Tech. Industrials weakened significantly yesterday, they continue to slide today. Expect the most pressure to be on the Dow.
Here are semi-conductors (Tech) gapping down from yesterday and trying to fill the gap.
AAPL is down -.95%, note the small parabolic move from yesterday near the close to the open today in yellow and also the common intraday reversal in red (in a downtrend look for a spike in red volume with a candle with a long lower wick, it's almost always an intraday reversal, although it works on daily charts too).
ES showed NO positive divergence on the bounce off the open (yellow box) and 3C is lagging ES a bit.
The Context Model for ES shows ES still overvalued vs the model (ES red/model green)
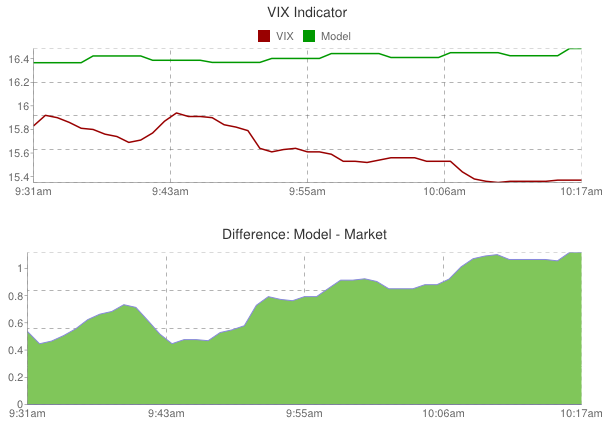
The Context VIX model shows the VIX undervalued.
For now it seems Financials are the story with the tug between the two currency pairs of EUR/USD and AUD/USD.


No comments:
Post a Comment