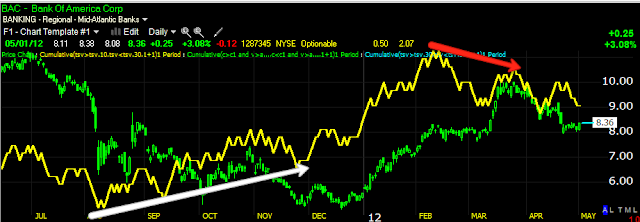
If I took BAC here, because of the charts you see below, it will be 1/4 position size to allow for room in case, but at least I'll have some financial exposure. I'll be taking a look at GS too.
This is Paulson's nightmare, selling around $5 after having taken a 50+% loss in BAC to see it double.
We apparently looked at shorting BAC from my notes and trendlines that were already on the chart and it was near the top in March, there was a triangle that had an upside false breakout before BAC fell-we almost always see the false break before a reversal, I can't emphasize that enough.
As for a LN channel, BAC was a channel buster on the upside, it appears to be bullish, but it is a volatility change in character that is almost always bearish (I know that sounds counter-intuitive, but it is about the change in the character of the stock. BAC already kissed the channel goodbye, while it is certainly possible for another run to the channel, at the position size I'm considering, I could afford it and I wouldn't be considering the trade if I didn't think there's a good chance that this may be it for BAC.
The head fake move in BAC? The most obvious is a move above local resistance on a closing basis as well as approaching a breakout on the intraday high, it fell 2 cents short.
The daily 3C chart shows the negative divergence as well as the positive that got BAC moving up and called a top.
Usually BAC responds better to the slower yellow 3C, but as declines are faster than rallies typically, the faster orange version is working better for intraday (more recent) trade. This is where the risk is, accumulation at the white area could send BAC quite a bit higher from here, possibly to the LN channel, however if the market breaks, the greatest directional gravitational pull on prices is the market itself followed by the industry group, in other words, it would be difficult for BAC to fight the market's tide.
The 15 min chart also shows the positive divergence, I would normally expect a bigger move out of BAC and that is why I'm cautious, but it is up nicely today and shorting in to strength as the market appears to be seeing heavy distribution is what I do.
Near term the 1 min is negative on this move up today.
The 2 min is negative
The 2 min is bleeding in to the 3 min
And now starting to bleed in to the 5 min.
This isn't my favorite trade, but it has strength. If I entered it, it is a phased in partial position of no more than 25% regular position size with the rest going to the stop and possible add to positions.
I'm going to look at some more financials before deciding, but it's one with good relative price strength and the short term charts seeing distribution and that's what I want to short in to.


No comments:
Post a Comment