DIA 1 min
DIA 3 min
DIA 5 min, the 3 and 5 min charts include positive divergences from yesterday that are out of scale so we can look at today's intraday action.
ES 1 min
IWM 1 min
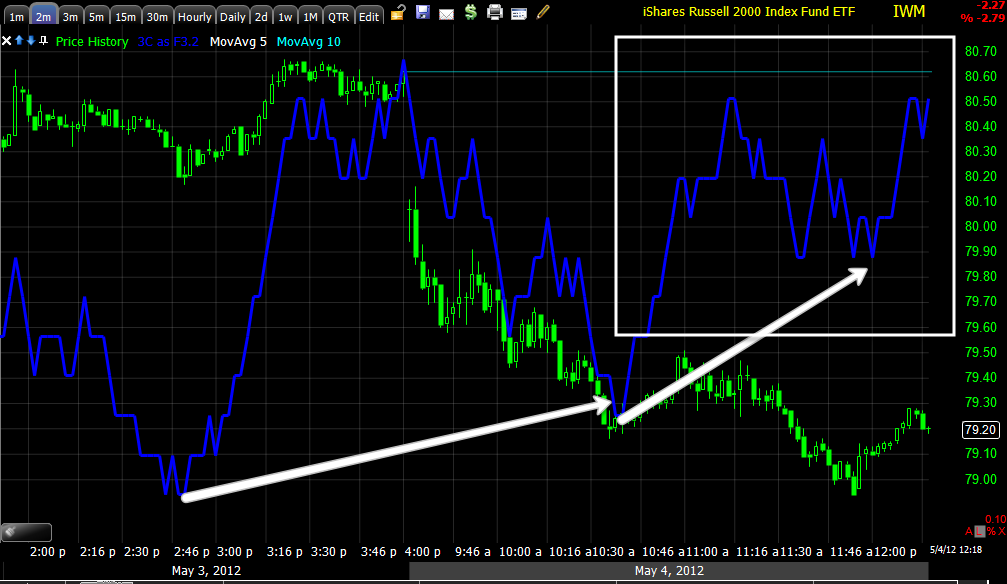
IWM 2 min
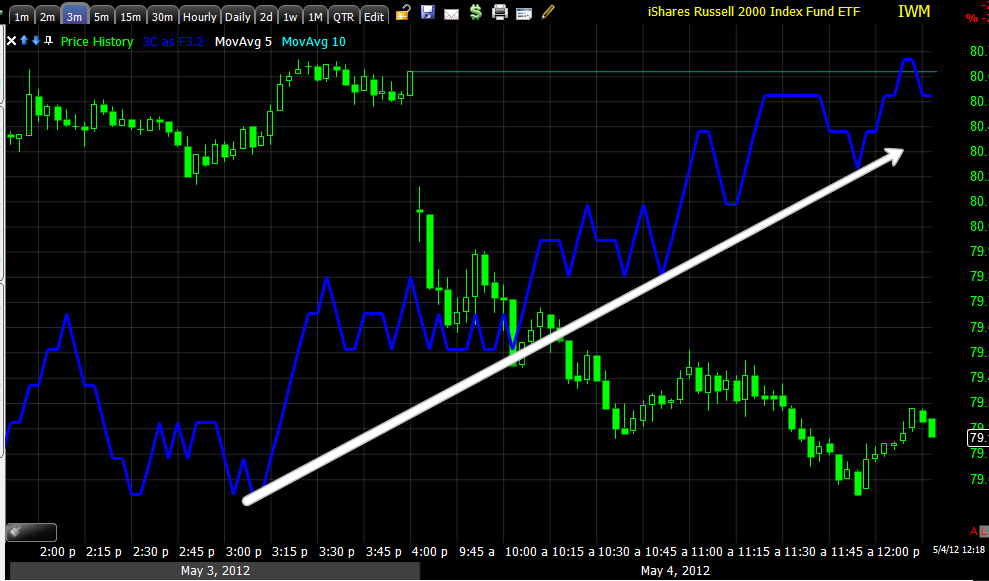
IWM 3 min
IWM 5 min The IWM 5 min chart still has a pretty strong relative positive divergence from the lows of May 2nd. While leading divergences are more intense and generally stronger than relative divergences, you must account for the depth and duration of the relative divergence.
QQQ 1 min, this is an example, the QQQ 1 min is leading positive today, but the IWM 5 min relative divergence over several days is a more important divergence. On this chart specifically, the arrows represent relative 1 min intraday positive divergences, the leading positive on this chart would be more important, more intense.
QQQ 2 min this is a pretty good looking leading divergence
QQQ 3 min is also putting together an impressive leading positive divergence, above the late day positive divergence seen yesterday.
The SPY is ok, although it seems to be the least responsive, the Q's the most responsive. SPY 1 min
SPY 2 min
I wish I could stretch this 15 min chart to leave some empty space to the right, I would draw a "U" shape as a potential move up, on the 15 min chart you can see today's move is rather parabolic, it's not very often we see a parabolic recovery that is sustainable. However the large volume on the break of a recent support area "if accumulated" would make a more "V" shaped move more likely as the need for a "U" shape is primarily time to accumulate, again if that is the intention which I believe it has been. In this specific case, someone needs to take the other side of the trade in all of that heavy volume selling, if smart money was on the other side, the need for time and a "U" shape is less relevant.


 | Theme by Thur
No comments:
Post a Comment