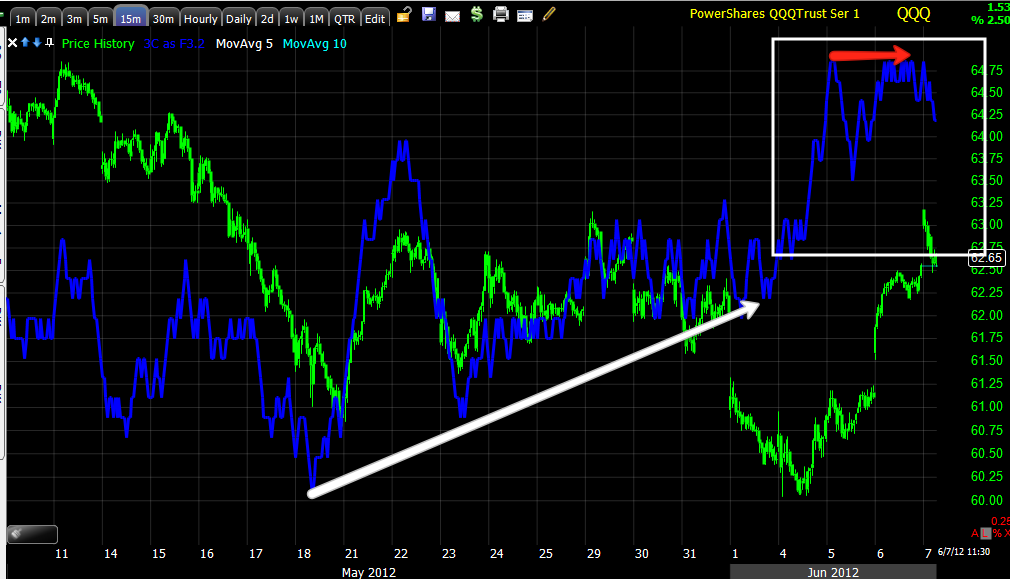
The most important chart in the post yesterday with the comments under the chart from yesterday...

And today...

Keep in mind a few things, first it takes a long time to capture and post this many charts so there's some movement between the first capture and the last, for instance the DIA/SPY were captured first and the IWM/QQQ last, some of the 1 min positive momentum on the QQQ/IWM is not seen on the SPY/DIA because it wasn't there when they were captured, now it is there and the 1-2 min charts look more like the IWM/QQQ. Also remember that the 15 min chart is the main trend, the shorter term charts are less influential. Last keep in mind that any changes start on the shortest charts like 1-2 min and if they are strong enough, bleed to the 3-5 min. The 5 min is showing something that has already occurred, the 1-2 min charts are showing something that is developing and if it is strong enough and continues, will effect the 3-5 min charts. This is a rather large post so the 1 min charts are changing rapidly, I've already confirmed the SPY/DIA looking like the QQQ/IWM


SPY 5 min negative on the open, a leading negative component, now starting to move up.

My initial take is the 15 min chart is still so very strong I don't think this is the end of anything, but rather some of the difficulties mentioned in yesterday morning's post. The 5 min represents what has happened already as does the 15 min, now it's the short term charts that will determine where we are going from here as they either continue to strengthen and effect the 25 min charts as I think they will or something else. I also think the 5 min charts' ugliness has something to do with where price is relative to resistance and retail bear's expectations as mentioned yesterday, it seems quite clear from a former post that the bear pennant was engineered, not naturally occurring, I think we may be seeing similar action now.


No comments:
Post a Comment