I've been warning for the last few weeks that the FX legacy arbitrage correlation between the EUR/USD and the market as well as Yields have become problematic and bothersome with regard to a sub-intermediate (albeit very choppy) uptrend, which has the capability to end with a bang and short squeeze.
There are a few other items that are curious such as commodities in general and their outperformance. Last Tuesday the underlying tone of 3C changed very quickly, at first I suspected some inside information was being traded, I'm still not sure, but for some reason 3C was stronger than it should have been. We may say that the situation culminated in late week strength and thus has resolved, but there are still some nagging details that aren't exactly in place preventing that.
As for the charts...
Last week I talked about not getting too hung up on your analysis as the market is dynamic and we re-drew some trendlines. I think this is probably the most probable pattern traders are looking at now in the SPX, a rather large bear flag; similar to GLD. Perhaps we have a slight break below the flag and then a break above in a large Crazy Ivan shakeout. In any case, this represents the choppy, sub-intermediate uptrend which could also be seen as the very early stages of a primary downtrend (bear market). I think this will most likely be the pattern we'll need to be watching.
CONTEXT for ES has been pretty close and is now showing the model a bit richer than ES itself, however several key markets are closed, the point being is underlying risk assets that re in the model are trading fairly close to their correlation with S&P E-Mini futures.

Commodities which have been lagging the market badly since the October lows last year and the subsequent rally off those lows, have very recently been performing much better than correlations with the SPX or more importantly, FX correlations would imply. I don't believe this is based on secret strength in Emerging Markets or China. Either there's some game playing which usually would not be this long lasting or something may be known by smart money that is being discounted. The only thing I can really thin of given the weakening 3C stance in the $USD (but still strong dollar prices) and a move higher than should be in commodities may be some inside information on a 3rd round of QE which has traditionally benefitted commodities. In fact once QE ended, that's when the severe commodity underperformance really became apparent (and of course weakness in China which we called weeks before the first hint came out last year).

Even early in this latest move, commodities lagged badly, then they came in to line and now are starting to out-perform, I don't think this can be solely attributed to the risk premium in oil because of the Middle East situation/s.
HY Credit was roughly in sync with the SPX today, this is one of the first choices of smart money in a risk on market with Investment Grade being the flight to safety trade.
Credit which often leads the market, was looking a little worrisome in June, but since has come back strong and it is this strength(if it continues to hold) that keeps me believing that we probably will still see a short squeeze move before the primary down trend reasserts itself.
High Yield Corporate of HYG is much more liquid as a hedge or investment vehicle, it clearly gave us a divergence that is in line with a small pullback of a day or slightly longer culminating today.
The longer term view of HY Corp. Credit remains pretty stable and supportive thus far of grater gains in the overall market.
Yields are an excellent leading indicator, almost like a magnet for the SPX, that is why the recent plunge in yields has been troubling, today's plunge is right in line with a sharp pullback in equities.
The recent trend in Yields has not been supportive of the market, it' been divergent and it's strange to see this dislocation while other assets like credit remain strong, this also makes me wonder if there is inside knowledge about a specific F_O_M_C/F_E_D program.
The $AUD took a big hit last week, but seems to be roughly in line with the SPX and supportive
Longer term-this is one of my favorite leading indicators among the currencies.
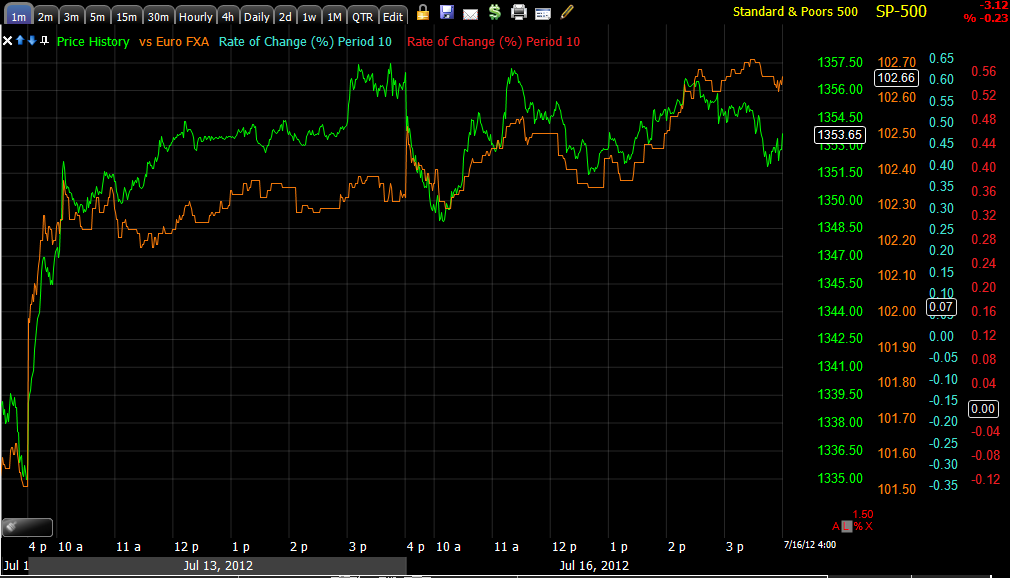
The Euro seemed to outperform the SPX today at least most of the day, I don't think it was enough, especially given the starting point or relative area the Euro is in, which has been another recent concrn with this layout.
Longer term the Euro has hit 2 year new lows and is way out of sync with the market, this is partly why I expected (prior to last Tuesday) the pullback to be quite sharp as the two should revert to some mean. My best guess is that the overall trend coming up will see the Euro move up on some short covering while the market pulls back and they should meet in the middle (be sure to throw in plenty of market chop).
As for the major sectors, today actually looks stronger than it was; Financials look good, Energy and Tech as well. The flight to safety trades weren't doing as well as I would have suspected (Utilities, Staples and Healthcare).
From what I see here, short term a pullback looks reasonable, it also seems like something is going on in the market that is not made its way to public knowledge yet as these assets tend to trend together and that's not happening with the Euro and Yields vs. Credit, the $AUD, commodities, etc. In the past we have had excellent divergences on this layout calling tops and bottoms, but all of the asset tended to move together, that's what is strange about the current market now. There are some strange 3C charts in the overall market, in currencies specifically, throw in some of the dislocations here and it seems there's something being acted on that is not public knowledge yet.


No comments:
Post a Comment