As mentioned, I feel the probability of a near term pullback/correction in GLD is fairly high, I probably would not cut the position size/risk on this alone, but with Bernie speaking tomorrow in front of Congress for his semi-annual brief, I view this as a real wild card event, thus I'd like to have some exposure, but that with the probability of a correction makes me want to lower exposure there. Whenever there are wild card events like these, you have no control whatsoever of the probabilities of what will happen, at that point your odds are more like Vegas rather than good analytical positioning.
If I feel very uncertain of direction or a wildcard event like this, I don't want to hope I get lucky and hit it big, I want to reduce or eliminate my risk.
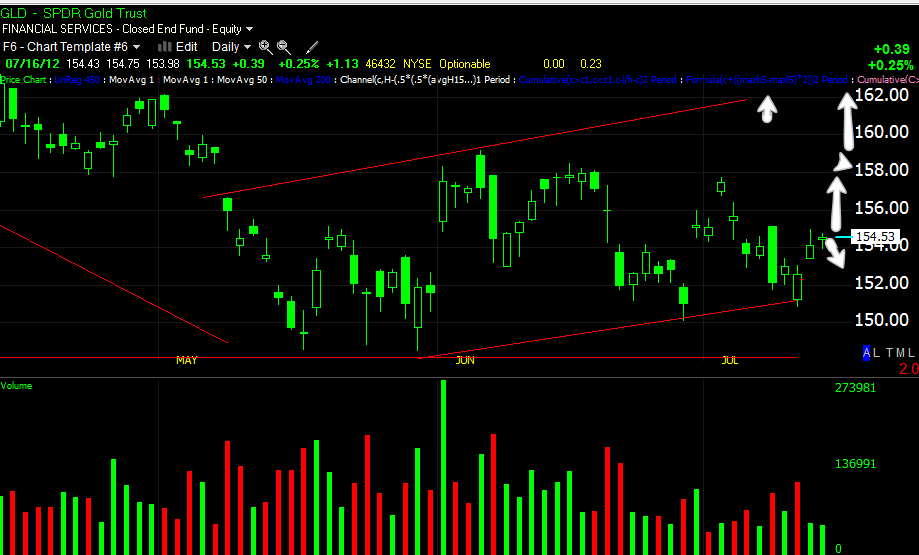
GLD charts...
This Aug. $152 Call position was opened Thursday and is up over 18% which is not the triple digit gains you commonly hear options traders talking about, but this is also not the kind of market that allows for those kind of gains, it's very choppy and being nimble is all important. Lowering the risk and re-entering the other half of the trade on some price weakness makes sense to me, I still view $162.50 as the likely target area, however time decay, volatility, etc all play a part in the value of an option, it's not as simple as a long position.
I don't ever expect anything to move straight up or down, but up with a correction and then up again, it's the Bernie testimony tomorrow that makes this a little more important, otherwise I'd likely not change anything right now.
In the near term this GLD 3 min negative divergence in a flat trading range looks like a pullback/correction is high probability.
The longer term 5 min chart looks good for the envisioned move to $162.50 (area-the top of the bear flag).
This is I believe about the 5th or 6th profitable GLD trade, the 15 min chart along with longer charts had us trading GLD exclusively from the short side as these longer term charts were negative and thus the direction of least resistance. Recently we have seen some positive changes in these charts and this is the first long position we have taken in GLD. As you can see, there's a change of character in 3C on an important timeframe from June to July.
15 min chart close up looks good today for our longer term view of a move to the $162.50 area.
Even the 60 min chart is showing a positive change in character.
This is beyond the scope of this post, but there are signs that the daily chart may be shaping up as well. Last year as GLD topped we were looking for at least an intermediate down trend, that has been fulfilled. Now it seems we may be getting ready to see gold enter another move higher as the daily chart shows. Finally the intraday charts are cooperating.
It's way too early though to think about trading that trend, I just wanted to remind you that it is developing.


No comments:
Post a Comment