As you know my two least favorite assets to analyze are Silver and Gold in that order, but there seems to be a near term change in GLD, actually one has already taken place and there's a longer term picture that seems to be changing, we were right on about the Intermediate downtrend back in Sept/Oct. of 2011, but now it seems that there are signs that either a new bullish intermediate or primary trend is starting to take shape, the actual trade in such a timeframe is still probably a ways off.
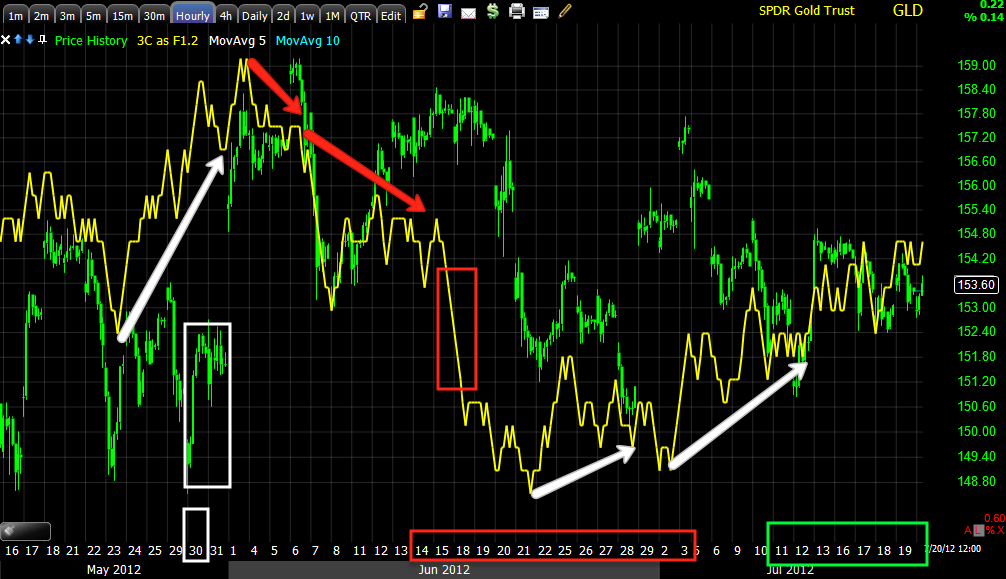
Over the last month or so we've been successfully trading GLD from the short side based on the 60 min 3C charts being negative, recently we switched to trading GLD long as that chart improved, I believe we've only had 1 trade in GLD long (calls), but it too was successful. It seems to me GLD may be entering a tight consolidation and perhaps nearing a directional breakout.
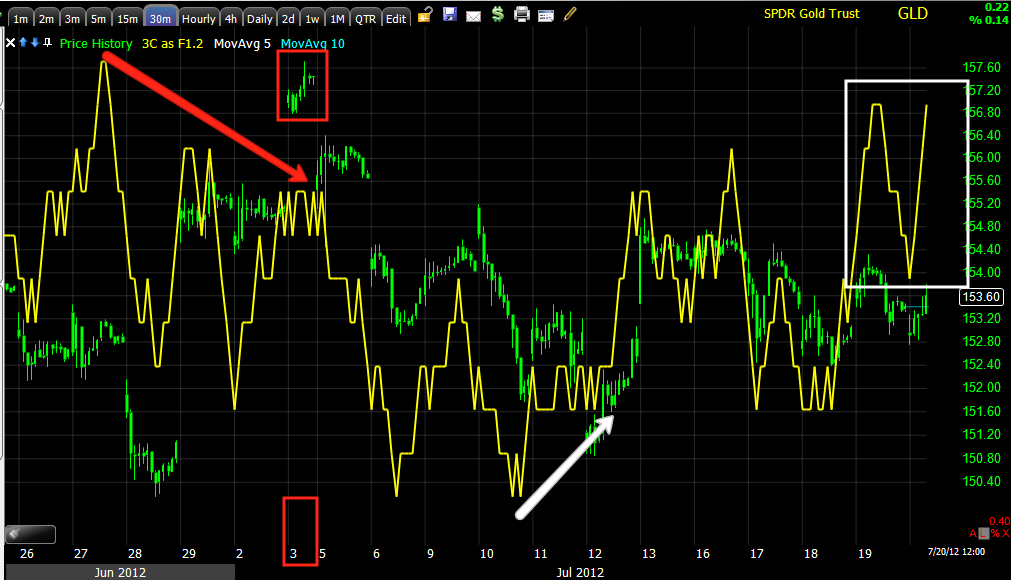
We recently re-drew the trendlines for GLD as the last ones served us well, but the pattern has developed in to something different. First we added this large bear flag, which could obviously be a bear trap as it is so obvious, now I'm adding a triangle inside the bear flag, which creates a diamond, the yellow daily bar outside of the trendlines was a head fake move on July 3rd.
On a 5 min chart you can see there was distribution in to that move up and thus we aren't concerned with that day.
On the hourly chart, one of the biggest GLD trades we've had since the hea fake short back in late February for 215% in a couple of days, was this long GLD on the 30th's positive divergence on the 60 min chart. GLD made one of the biggest 1 day moves in years and that move up was promptly sold in to as you can see the negative divergences on the move up (red arrows). The dates in red are where we had been trading Puts in GLD a the 60 min chart looked bearish at the time, recently it has shaped up and now I'm more inclined to trade GLD short term from the long side, but a you can see above, the triangle is likely to create a tighter trading range over the coming days.

The 30 min chart is also shaping p since looking pretty negative and showing a head fake move July 3rd in to distribution. This 30 min chart has a little bit of a leading positive component to it, thus it looks like we are going to see a directional move higher in GLD, I'm just not quite ready to commit to a trade there yet.
The 15 min chart also shows the accumulation of the 30th with the move up being distributed, also the head fake move up of July 3rd and recent strength developing.
Now looking at the intraday charts, this is the 1 min chart with a positive divergence on the day's lows with a slight negative as of this capture, remember this is mostly for intraday moves.
The 2 min chart also shows a positive divergence at the day's lows and a slight intraday negative recently, since the capture it looks like this negative divergence is causing GLD to consolidate laterally.
The 3 min chart is pretty much in line with a little strength present.
The 5 min chart is showing the same, there's a bit of a leading positive divergence currently and a positive divergence at today's lows sending GLD higher.
I'd like to enter GLD long as of these captures on a pullback in to positive divergences or a consolidation laterally with these divergences in the 1-5 min timeframe growing stronger. I don't want to chase this. As for the longer term timeframe like the daily and the longer term trends, the hints are there, I don't think the trade is there yet, but we'll take a look at those timeframes soon.


No comments:
Post a Comment