I was trying to capture multiple ES 1 min charts to show you where the leading negative divergence in Es would be, it's actually pretty hard because of the limited data on the TOS chart used for ES and how 3C doesn't scale the same way (I think mostly because of the limited data and price changes changing the scale). It was getting complicated as I started annoting the overnight session which can't even fit on 1 chart on the 1 min timeframe, so I thought maybe it's easier just to use a longer timeframe, although ES divergences tend to be stronger compared to a SPY divergence of the same size.
I think this should at least give you some idea of the action in the recent days.
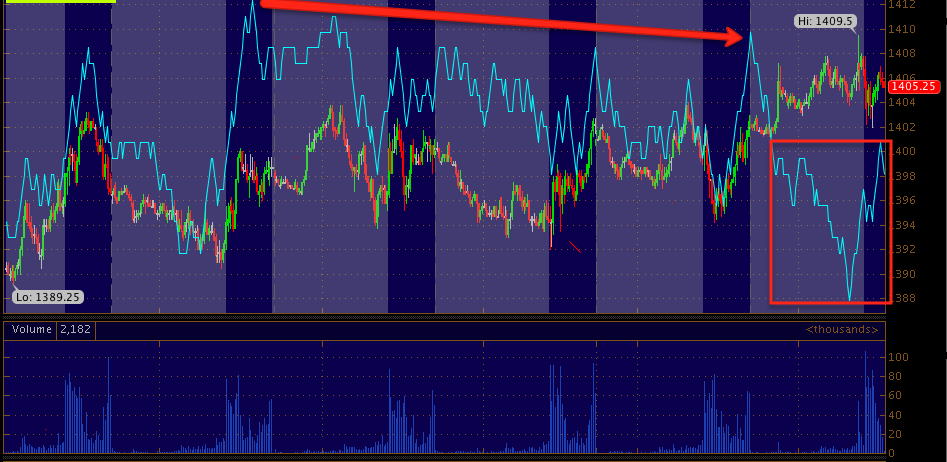
ES 5 min from yesterday at a new even deeper leading divergence and yesterday just before the close we were already making new leading negative lows, so this seems to fit very well with the ES manipulation post from last night and what I suspected, distribution in to an easily manipulated thin market.
Here's a 15 min chart which gives you some idea of the tone of underlying trade from a range bound market area to the break above today creating the pivots I talked about last night as seen at the last 3 previous major reversals this year that gave the same signals we have now.


 | Theme by Thur
No comments:
Post a Comment