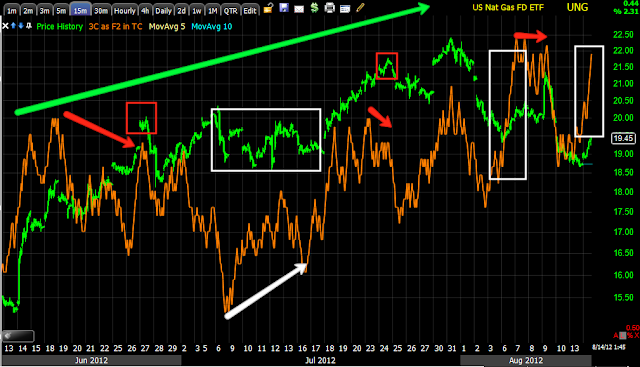
If you don't know, UNG is one of my ONLY long term long positions I like and it is the only Core long in the equities model portfolio. UNG showed us a change of character a while ago, although price kept heading down in to positive divergences, if you had bought around the area where we first spotted positive divergences and added on subsequent divergences at lower prices, you should be in the green in UNG.
However, a 20% gain is not why I like UNG, I think this has the potential of putting in a lot more than that or I wouldn't include it as a core long position.
There are a few concepts in this post that I will show you or enforce and there's bullish looking activity now.
The daily chart shows the concept of a bearish or bullish candle with a volume spike acting as a short term reversal, on the first one the next day we saw a -7.58% decline, the second one (a bearish Shooting star candle) with increased volume led to a 4.42% decline the next day and only lasted 2 days like the previous candle. So again we have sen this concept today on intraday charts and now here it is on a daily, as I said, it works on all timeframes.
Otherwise, UNG is looking like it will run above resistance, it just needs a bullish day with volume to jump start a stage 2 mark up where it should start trending up well.
As a long term position, I'm using a 3-day Trend Channel stop which held the entire downtrend and stopped it out at the small red arrow and then went long and has held that entire move, thus far over 26%.
Using the 3 day X-Over Screen to prevent false moving average cross-over signals shows where UNG was a solid long on 3 signals; it also shows the pullback to the blue moving average which is a typical area this far in to the move.
The 1 min chart went berserk at the flat range and headed up from there.
Intraday it looks like it may be a little overdone and seems to be seeing some profit taking, but a 1 min divergence can also be just enough to create a consolidation as we see in yellow.
The 3 min chart is also showing a huge leading positive divergence at the same flat area in price.
And the 5 min saw migration from those timeframes with a relative and then leading positive divergence. If I wanted to start or add to UNG, I would consider this a good area, although any intraday price weakness would be even better.
I marked several 15 min divergences, but the overall trend in 3C has been of confirmation (green)
Here's the 4 hour chart, the big picture showing downside confirmation to a huge set of leading positive divergences. UNG has established a base that is large enough to support a solid uptrend.
Is interest rates about to start going up?
-
Yes, I know - it does not make any sense - FED is about to cut
rates...but....real world interest rates are not always what FED wants it
to be.
6 years ago


No comments:
Post a Comment