As shown earlier, there's no risk appetite in commodities right now, USO/Oil bouncing to the gap may slightly change the complexion, but not much.
Commodities as a risk asset are not at all thinking like the SPX as a risk asset, not that the SPX is up much.
Yields continue to diverge negatively.
And today... Equities almost always are pulled toward yields when they diverge.
And the $AUD as a carry trade currency is an excellent leading indicator among the currencies and I think bolsters the argument I have made (mostly referencing AAPL) about hedge funds de-leveraging, de-risking or just plain old selling.
A closer look at Yields today, a month ago these were in lock step with the SPX.
As for more confirmation and timing of the move I suggested...
Treasuries as the flight to safety trade... 3 charts tell the story and I couldn't make this up, I'm just following the clues.
As you know from Friday, the Wed/Thurs positive divergence already started falling apart by Friday, it had went negative on the 1, 2, 3, and even some 5 min timeframes which is where the positive divergence ran to, the 5 min chart, so once that 5 min is negative, we almost certainly have the next leg down, we've been heading that way, but remember VWAP and AAPL, 1 last move which would allow the 5 min to go negative across the board.
The 1 min TLT chart is negative, it moves opposite the market, so a pullback here would be in line with the move up in the market.
However just as the market's longer term charts are very negative, TLT's 2 min chart is hugely positive, in yellow you can see the gap that would likely be filled. However a 2 min chart is hardly convincing, it just shows you how close we are.
a leading positive (new high) 30 and 60 min chart in TLT both suggest the flight to safety trade is complete, just waiting for the price trigger.
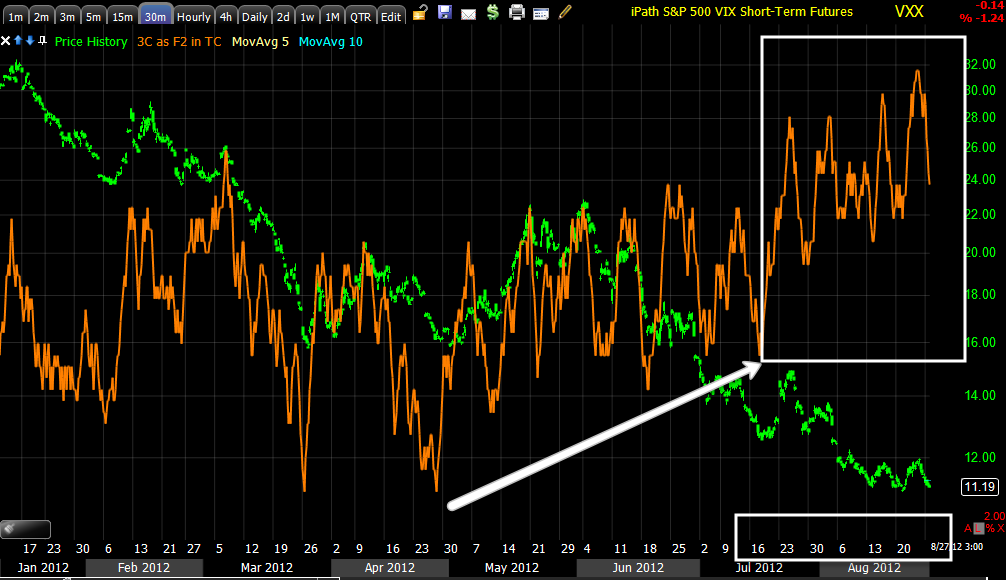
How about volatility, it also trades opposite the market so the market going down produces higher volatility.
Again the 2 min trend is extremely positive, this isn't convincing about how strong the trend is or the accumulation, just how close.
For the strength of the accumulation, this 30 min chart leading positive to a new high (like TLT) with the market having many averages leading to new lows, is convincing.
Again, in my view, if I were a longer term trader who didn't have time to watch the market all day, I'd be fine shorting most anything out there that is a risk asset and just look at it in a month, for those looking to time trades for options, etc. this appears to be your chance, you should have price strength (better entry and less risk) and you have the underlying signals all lined up (high probability trades).


No comments:
Post a Comment