I do believe it is. I already started a full position equity short in USO, I think we may get a decently timed move to enter Puts if you like, it would also be an area in which a longer term short position in USO stock would be interesting.
Here's what we have from macro to micro...
On a Swing Trade basis using the 60 min Trend Channel, USO is VERY close to breaking the channel and becoming (on this chart, but there's more to the story) a swing short.
This could be a little miniature Island top, but chances are greater the gaps get filled, if they don't something very bad has gone wrong in the market, if you may be looking at Put position, that's your set up, as for a longer term trending short in equities without leverage, this is really close enough that I wouldn't be concerned about a little draw down on a gap fill, or as always phasing in to a position is another option.
On a 5 day chart you can see where USO is running in to massive overhead supply or strong resistance. You can also see where it has its head fake top in place and I only mention this because it's such a regular feature of a reversal.
This is the daily Trend Channel and the concept of Channel Busters, they seem bullish in the near term, but again, price is deceptive, they almost always lead to a pullback and reversals. We also have a confirmed Candlestick reversal in orange, a break below the red trendline will be very strong evidence against USO as the channel is based on USO's own trade and character.

On a long term MoneyStream chart (The guy who created this is the Father of All money flow indicators), it is very clear how the end of Quantitative Easing changed the outlook for oil and the perception among money managers, with QE oil is a buy, without it, it becomes harder to justify the prices given the economy. With an election coming up, oil/gas prices will be front and center, you've already heard the Strategic Reserve Release stories by the sitting president. Money Stream is not great with short term signals, but great with trends. For example, 3C called the top of a 5+ year run in oil to the week in yellow, MS missed it as it unfolded quickly-again before an election, but the QE trend is clear.
The 4 hour chart is pure trend, not detailed, not noisy. I think it speaks for itself.
The 30 min is more detail, this also speaks for itself, you can see why I wanted a core short in oil I hope?
And the 15 min is quite clear, that's a lot of confirmation on important timeframes. That sets up the trade direction, now it's just the type of trade and execution.
The 5 min chart, very negative, but a small relative positive divergence, this is along the lines of a gap fill move.
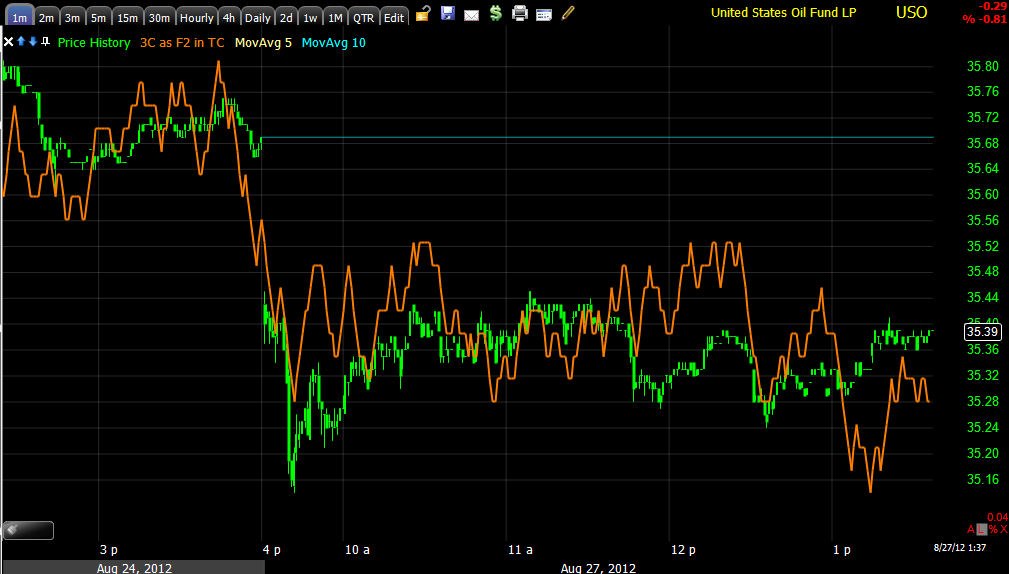
The 1 min chart here tells us nothing, but the trend does...
Slightly leading positive, good for a gap fill move perhaps.
The 2 min chart seems to tell us intraday that a positive divergence is building, again good for a gap fill move, but the trend tells us more...
It is leading negative. So we have about 3 very weak positive divergences, along the lines of a gap fill move, this is would probably make sense for a Put position as we could enter it in to price strength, but underlying weakness, it could also be used to time a core short in the ETF itself.
However, I am partial (at least for a non-leveraged short) to phasing in as the market seems to be at a very transitory spot, just like I entered a partial position in AAPL Friday even though I thought probabilities were for more upside, I wanted to get my foot in the door just in case. With options I think timing is more important and if you miss the trade there's always another.
Finally just look at commodity and oil's recent relative performance...
Commodities in general are in a total risk off mode while the SPX makes good on that positive divergence of last Wed/Thurs., a clear set up, not based on strength, but games.
Oil doesn't look much better.


No comments:
Post a Comment