In yesterday's USO post I reminded you about the USO short position closed out and my view that USO was getting ready to make a move higher, one that was in my view tradeable, although I'd be a little cautious right now in all positions until we put together the rest of the pieces and understand where the probabilities are highest, thus I said I'd consider a speculative USO position.
This morning USO is up on some overnight strength in crude. I'd take a look at yesterday's post as the daily chart shows what would normally be a very clear bearish set up as the channel failed and broke, I don't like taking large positions on initial breaks as they seem to always see a volatility shakeout to the upside. That's one issue, the other more obvious issue is the effect of QE3 on oil as well as the macro-economic situation in which there's likely going to be less demand for oil, especially at higher prices, also the middle east or muslim outrage. the geo-political considerations as an armada amasses in the Straits of Hormuz and finally now Taiwan has joined in the dispute with China and Japan over two barren islands.
Lets take a look at USO (yesterday's post linked above will give you the background information).
This is the daily chart, there's at least a gap to be filled and a move above the red trendline wouldn't surprise me. What happens with oil after that is where it gets interesting. For now if I was going to trade it, it would be to the upside until we see signals saying different.
This 30 min chart with price pullback and a leading positive 30 min divergence is what is missing from the market averages, this is what I would have expected QE3 accumulation to look like at bare minimum. So I'd be trading oil/USO long on the leading positive 30 min divergence here.
The longer term question of oil needs to be answered, but until we see how it reacts on a move higher, it will be difficult. As things stand on the 4 hour chart, it has called the reversals in USO and is showing the largest negative divergence of the year right now, but most of that was put in before QE3 was announced.
The white arrow is around where the USO short was covered, this is a 10 min chart with a nice leading positive divergence also.
The 5 min chart also leading positive
Intraday it looks like we may get a pullback in to a gap below, that would likely make for a nice entry once these charts start going positive again.
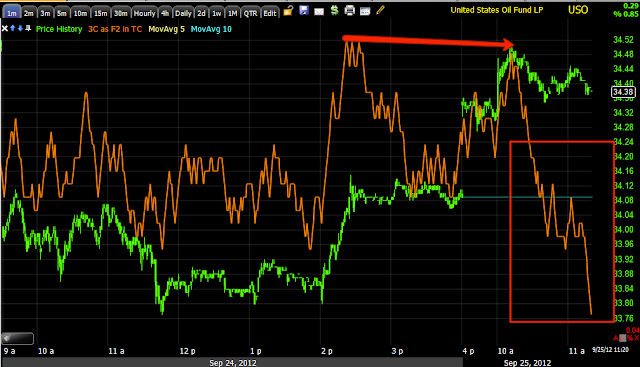
You can see that intraday 1 min negative divergence has migrated to the 3 min chart as well.
Also CL (Crude futures) are showing a similar 1 min negative divergence which is an intraday signal.
I'd be looking for price to pullback in to the gap (yellow area) with the 1-3 min charts starting to go positive, a stop can always be placed below the recent lows around $33.75. You might also consider phasing in to a position in USO or one of the derivatives, but as I mentioned yesterday, I don't think this a time to swing for the fences just yet.
Is interest rates about to start going up?
-
Yes, I know - it does not make any sense - FED is about to cut
rates...but....real world interest rates are not always what FED wants it
to be.
6 years ago


No comments:
Post a Comment