Yesterday as intraday signals were scarce, I looked elsewhere and a few minutes later posted,
"Other Indications" and along with two other indicators, this very small move in credit intraday yesterday, was the signal in which I said I thought the market would move up intraday from there.
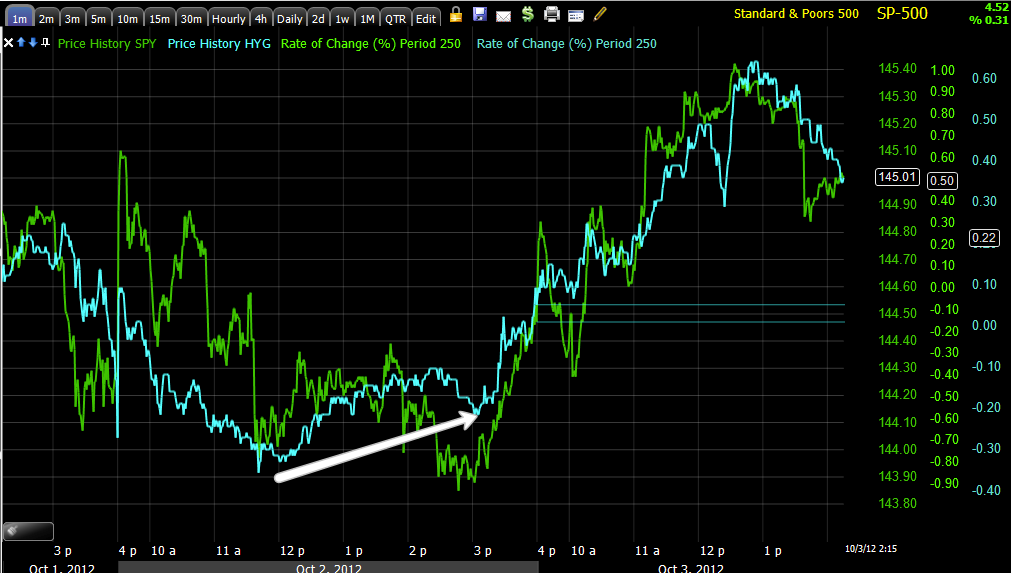
High Yield Corp. Credit (blue) vs the SPX (green) showed relative strength in credit and as we have sen over and over, Credit tends to lead stocks, even on an intraday basis.
I now there are several emails I need to get to, but I really want to be paying attention to the market in front of the ECB tomorrow, I'll get to the emails.
As far as Risk Assets today and longer term...
Risk assets are vs the SPX, the SPX is always green.
As for HY Corp. Credit today, it looks to be in line, but if you look closer, the SPX broke lower at the green trendline while credit has held up at the same area in intraday.
In this chop area, Credit looks a bit weaker overall than the SPX, that usually isn't a good sign for the SPX, but it isn't that bad of a divergence.
Here in the run up to the QE-3 announcement, Credit discounted or front ran the F_E_D more than equities and that's saying something, HYG credit broke down at the first when looking at the same relative position on the 13th, it also is leading lower and not confirming the SPX's most recent reaction high, this isn't great for the market, but is very much on par with the murkiness of the market which I still believe is being caused by asset re-allocation, expensive stuff being distributed, cheaper stuff being bought in some cases, so instead of our normal directional market, we have a fractured market-breadth readings should be very interesting.
High Yield Junk Credit looks like HYG Credit above.
Intraday High Yield Credit is showing the first bit of weakness I've seen there in a week or more as it had been mostly in line with the market.
Yields were also one of the assets used yesterday for intraday analysis as they held up better than the SPX and they have a leading component to them, you can see the SPX's reaction from the small divergence, today not so good.
Longer term yields (which are like a magnet for stocks), don't look good at all, this is the biggest negative divergence between the two since we have used yields which have called every major reversal this year.
The Euro (I need to look at underlying trade in the FX space), also showed better relative performance yesterday in white, although the market did rise with a rising dollar which is not typical toward the close (red), thank AAPL. Today the SPX is returning to short term reversion to the mean.
Longer term, the Euro and SPX are both risk on assets and have tracked well, but have since come unglued since the 13th as you can see negative dislocations in arbitrage correlations.
I know the RBA cut policy rates by 25 basis points yesterday, still the $AUD underperforming the market like this can't be taken as good news short term or intraday.
Here's where the $AUD gave the market support in white and is now negatively divergent in red.
Commods also held flat yesterday while the SOX made a lower low, a positive divergence for the market, today, not so much-thank Syria and Turkey.
Here's sector rotation since yesterday, Financials in, Energy out, Basic Materials where a lot of high Beta stocks are, out, Industrials moving out, Tech looks to be in and Discretionary is holding its own.
Defensive sectors are just as impressive today as the risk on Financials, Utilities, Staples and Healthcare, BIFURCATED!


No comments:
Post a Comment