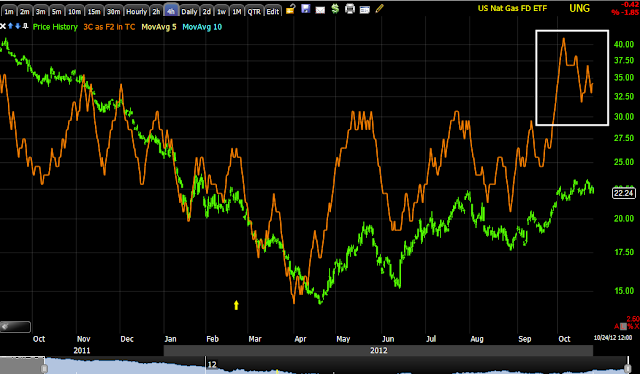
One of the first hint other than what we saw on the charts was Bernie's semi-annual Congressional testimony when a congressman asked him a question out of left field that really had nothing to do with Bernie, the F_E_D or anything they were talking about and certainly wasn't Bernie's area of expertise; what it was however was a forum to plug Natural Gas while a world of investors were closely listening to the event. The question had to do with North American Energy independence and specifically was related to how natural gas could further our country's economic prospects, or in other words a shameless plug. Since watching the debates, it seems clear the Energy independence is a platform both candidates are running on and natural gas seems to figure quite high in the equation with either candidate. Obama's administration passed a law that would essentially make it impossible to build any new power plants from anything other than Nuclear or Natural gas, clean coal wouldn't even meet the standard, so long before we had a clue as to why UNG was shaping up, we saw the accumulation there and followed it, had we waited we wouldn't have a decent profit right now and good positioning.
As far as those who want to add or enter new positions, I would say, "Patience". To me it looks like UNG is in a consolidation, specifically early on in a bullish ascending triangle that will probably see a head fake move below support-that's where I'd be looking to add. We do have the EIA Nat Gas report tomorrow morning and we should see some chop/volatility in the triangle, but I would still wait for the trade to line up just right.
The charts...
UNG daily MoneyStream Chart with a huge leading positive divergence, however we were on to UNG long before MoneyStream gave a signal, in fact we were already long UNG.
It was really a 5 day chart of UNG price/volume that showed a change in character and those precede changes in trend, after that we started paying more attention, this 4 hour chart shows a leading positive divergence much earlier than MS and a current leading positive that looks like UNG will soon enter Stage 2 mark-up which is what we have been waiting for as the next major event in UNG. I said this would be a long term long position and it has been a profitable one even at that, without stage 2 having kicked in yet.
Here's the bullish consolidation price pattern where it should be, following a move up; it looks to be a little more than 50% complete. I would suspect a downside head fake move and that's where I'd want to try to enter UNG, that should be followed by an upside breakout.
Here's a closer look on a 30 min chart, we are at the lower support range, perhaps we get a head fake move here, but it seems a bit early, however the sooner these patterns breakout to the upside, the more powerful they are, especially with a failed break to the downside preceding the breakout.
The daily Bollinger Bands also show they are starting to pinch as this price formation matures.
There are plenty of positive charts in UNG, but short term this 2 min chart seems to indicate a head fake break down move is the highest probability, I'd want to add when I see that and this chart shape up and go positive, so PATIENCE.


No comments:
Post a Comment