The leading positive in the Euro/FXE along with all of the other indications makes this look like the breakout area from our range.
Last Sunday before we even had a range, we were looking for one to form last week and then break out to the upside which would be the EXACT OPPOSITE of what technical traders would be expecting as a rectangle consolidation after a downtrend is considered a bearish consolidation/continuation pattern, but that was the entire point, A SHAKE OUT OF THE SHORTS and this is why we set up leveraged longs for the move up last week in to price weakness.
AAPL, surprisingly you may find was one of the models for this move so I would expect AAPL to put in a pretty decent move up.
Thus far we are seeing some of the averages break out of the ranges to the upside, this is where the shorts become a little nervous, but it's not enough to cause them to panic yet, although the SPY and IWM are showing some volume on the upside break from the range, the Q's aren't quite there yet.
The 1 min charts are mixed, but it's the longer term charts that have been forecasting this move and those are solidly showing price where we've expected it to head, whether it just be market behavior that we observe ad the way Technical Traders are used to make profits as they are so predictable, or 3C indications, leading indicators, the market defending Euro $1.29 and SPX $1400 over and over again, currency charts, credit, you pick, they've all been lined up forecasting this move, again a move that is 100% the EXACT OPPOSITE of what Technical traders have been indoctrinated to believe should happen.
Here are the market averages thus far...
Although a bit early for looking at these, the 1 min DIA is lagging a bit, suggesting an intraday pullback, which sounds about right, but I suspect only after all the averages have crossed resistance and the Q's still need to.
The bigger picture is also the more reliable probabilities and they have been forecasting this move up and out of the range and then some (perhaps quite a bit) with leading positive divergences in the Swing timeframes (Swing as in the swings the market has been putting in lately or what I call cycles). Remember what I said this week, "Once Wall St. sets up a cycle, they rarely abandon it", that's because it costs money and they have changed their short term positioning, that's what the range is all about, giving them the time to change short term positioning.
DIA breaking above the range.
QQQ is pretty close to in line on the 1 min opening indication, currently since this capture, it's perfectly in line.
The QQQ 5 min recent leading positive divergence made it look like last week's (Thurs.Fri.) head fake moves were moving us closer to this point. The Q's break the range around $65.85.
QQQ head fake moves last week under the range are a good timing indicator for an impending reversal.
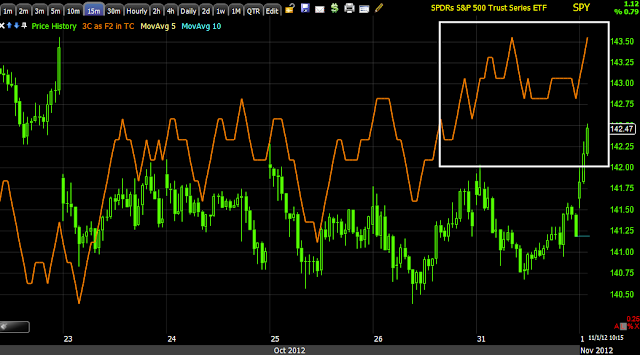
The 15 min leading positive increasing last week and this week show the SPY getting ready to make today's move.
SPY over the range.
Hopefully those leveraged longs we set up last week are working for you today and will continue to do so.


No comments:
Post a Comment