Usually we look at opening indications to see if the market's open, whether it gapped up or down is seeing similar money flow on the open, for instance a gap up should see higher money flow and 3C should move up with the gap, when that doesn't happen we have a contradiction between price and the underlying money flow that tells us the probabilities are high that the gap up is weak as it doesn't have the money flow to support it, that can change through the day because we are looking at very fast and smaller money flows that we can read that early in the day, but where we are now, there's no way for the market to confirm, there's too much damage.
As for trends...
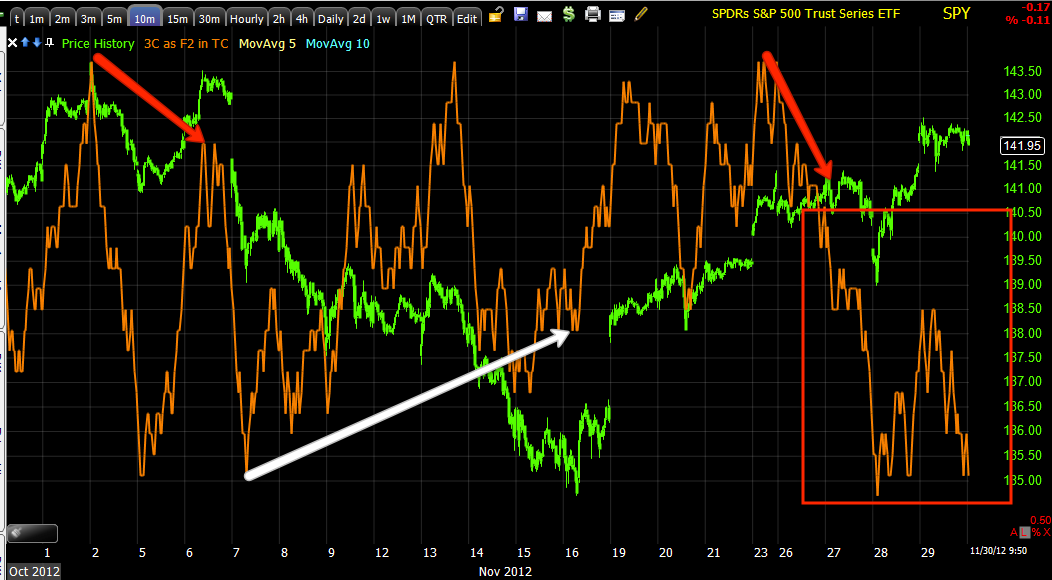
Using the clear method (slightly modified) the trend to the left makes sense, there are pullbacks, noise candles that don't mean anything and then there's this trend which is a loss of all momentum, no trend other than lateral in the SPY.
You can make a case for a bullish triangle here, but from the looks of other indicators, a failure at the triangle is the highest probability, perhaps a head fake move above the apex as it is so close here before the reversal as we almost always see, other than that the volume structure for such a pattern is completely wrong.
This is the DIA 1 min chart, this is why there can be no confirmation, the underlying money flow is significantly less than price, there's nothing there to support price; this is a common theme.

Longer term the markets have been suckered higher, whether algos, the invisible hand of the PPT or something else, there simply is too wide a gulf between confirmation and a divergence contradicting the strength in price, it's been there for longer than usual, that usually means a nastier than usual correction.
IWM 1 min is the same

As is IWM 10 min, it's calling for a serious correction.
QQQ 1 min can't confirm the open, 3C is too far away, there's too much short term money that has flowed out.
The QQQ 5 min chart is the same as the other longer charts above.
The SPY 1 min will have trouble confirming anything but a decline in price.
And the 10 min chart speaks for itself.
This simply can't keep going for much longer if any longer.


No comments:
Post a Comment