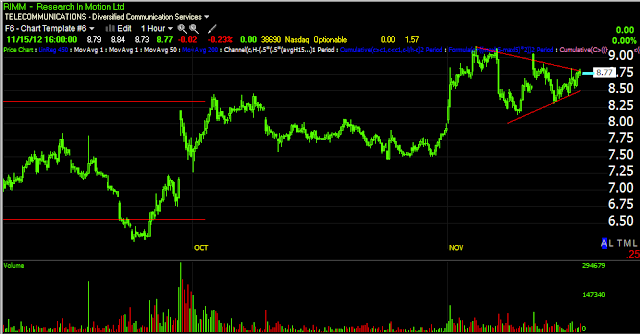
I've written about RIMM a couple of times this week and this is one we've been following for a while, both long and short.
There aren't many stocks out there that have longer term signals that suggest something more than a manipulated push higher, it suggests there's some real underlying interest in the stock.
You may recall shortly after the September 13th QE3 announcement I said the high flyers look horrible and the stocks that have been beaten up look good, almost as if people were out bargain shopping. Take a look at AAPL vs something even like RIMM, that's my point!.
Any way, lets follow up on RIMM, I'm still trying to identify the best set up and how that might come about, but this is another one that I wouldn't obsess over getting in at the exact bottom, you may very well miss a great opportunity trying to get too fancy.
RIMM is showin the signs of the classic price cycle, you see these short term, long term, in stocks, in market averages, etc. It is the nature of human emotion that drives these cycles and maybe the business cycle a bit too (read that as F_E_D policy). Stage 4 is decline, stage 1 is a base and accumulation, stage 2 is mark up when we see a breakout from the base and the asset starts trending up, this is where the easy money is to be made and probably close to 80% of the move. The secret to making the money is understanding the trend and not getting shaken out on natural/healthy pullbacks.
Here's a closer look at the base or stage 1, this is where we should see accumulation. Remember how I talk about, "The kids being too quiet"? Usually when that happens they are up to something, it's the same with stocks, when price is flat like this nobody is paying attention to RIMM, it allows smart money to accumulate shares without the scrutiny of every momentum trader out there, it also gives them a stable price; my guess is the process of filling the order has a large part in creating that flat range and stable price (think VWAP).
This is the exact spot we see the range above, there's a clear 60 min positive divergence, this would confirm our base.
Since the move above the base, we haven't seen the huge volume spike that will pull in momentum traders on a breakout move yet, I expect it's coming, if we aren't already in RIMM, we want to be in it (if you like the trade) well before stage 2 begins. We have a visible triangle in place right now, I'd think the probabilities are highest that there's a break below the triangle before a breakout to the upside, but that also depends on the broad market. This is the type of situation in which I would ease in to or phase in to the position, maybe 1/3 or 1/4 at a time, this way we can get a decent average price and we can make sure things are going the way we want before we establish too much risk.
The short term charts suggest there's a breakout on the upside coming, whether we get a downside break first or not is hard to say, usually I'd expect it and the closer we are to the apex of the triangle, the smaller the downside move needs to be to break below the triangle. In any case, whatever the tactical situation is, the strategic looks good for a move higher from here as we see a number of short term positive divergences in addition to the longer term ones in place.
5 min chart
At the same triangle, the 3 min chart is in a clear positive trend
And while it looks a little different, at the same place (the triangle) we have another positive 3C trend considering price is moving laterally in the triangle and 3C is clearly moving up.
RIMM may be one of only a few stocks I consider to be a long term core "long" position, like UNG.
Is interest rates about to start going up?
-
Yes, I know - it does not make any sense - FED is about to cut
rates...but....real world interest rates are not always what FED wants it
to be.
6 years ago


No comments:
Post a Comment