Keep in mind this isn't considering any of the confirming indications or assets, etc, it's just the signals in the averages themselves. As far as the short term intraday moves go, the Futures haven't shown much, but ES is starting a 1 min leading positive divergence, the first of the day.
Here are some of the deteriorating or already bad negative positions in the averages.
DIA 3 min was already relative negative (red arrow) and leading negative (red box) which is a stronger divergence than a relative divergence. Today the 3 min added to the leading negative downside to a new low. While the 3 min chart may not be significant looking at the 1 day movement for much more than intraday or day to day, the trend is much more significant.
DIA 15 min with a relative positive divergence, guess where? Yep, right at the 28th/31st lows. Currently there are two leading negative divergences, 1 longer term represented by the arrow and the near term which is more pressing for the immediate future in the red box.
A leading divergence on a 15 min chart is a strong signal.
IWM 1 min was in line with price until the IWM hit all new highs and look what happens, a leading negative divergence, the new highs are aggressively sold. This is just another reason why I'd be using any intraday strength to sell or short in to, not to buy (generally speaking as there are always exceptions to the rule).
IWM 2 min with a positive divergence going right in to the 28th and 31st, coincidence that all these averages and stocks all go positive at the exact same time?
Currently a leading negative divergence with new lows just as IWM makes all time new highs.
IWM 10 min has remained in leading negative position, never confirming the upside on this stronger timeframe. You can see the 11/16 lows and the positive divergence in to them that started this current cycle.
IWM 15 min leading negative divergence. This is a strong move and right when the IWM hit new highs.
A leading 30 min divergence intraday? YES, again, at the IWM highs, this is a huge move for an intraday chart and very strong distribution signal.
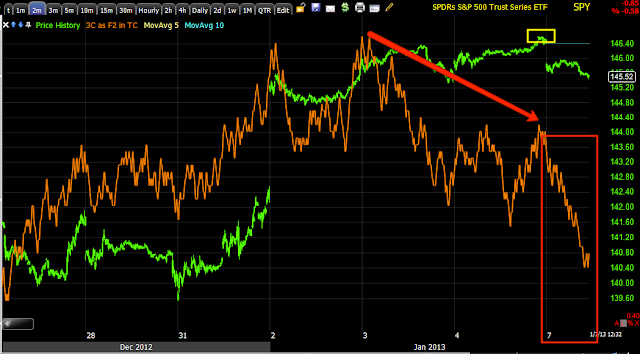
SPY 2 min, as mentioned is not going positive or backing up the 1 min char, it is leading negative at a new low on the move just after the breakout above local resistance.
10 min SPY also leading negative on the same breakout. Also note the positive divegrence and where? Again, Friday the 28th!
Is interest rates about to start going up?
-
Yes, I know - it does not make any sense - FED is about to cut
rates...but....real world interest rates are not always what FED wants it
to be.
6 years ago


No comments:
Post a Comment