This covers the Energy sector from the longer term charts which are the big picture, they are also the hardest to manipulate so the data on them is very clean, actual trend or what has been happening in underlying trade.
I'm also including some confirmation charts of ERX and ERY, it's important to understand what each is, both are 3x leveraged ETFs for the Energy sector, ERX is the long 3x Energy Bull so the signals in ERX should be similar to the signals in XLE as they are both bullish Energy in this circumstance, ERY is the 3x leveraged Energy short or Bear ETF, it is the way you'd express a short bias on the Energy sector (by buying the ETF).
So XLE and ERX should look similar with 3C signals, ERY should look nearly the exact opposite, ERY long is the one I like here.
XLE/Energy Sector
I didn't want to draw on the chart itself because I think the divergences are so clear and you can probably understand 3C better without a bunch of scribble, this is the 60 min chart, one of the longest timeframes we use for trading and a very powerful signal, it is leading negative after having been in confirmation. This is why I have been encouraging ERY potential longs who have been emailing me nearly every day (which is fine) to wait as we are moving toward the position, but not there yet. I do like the ERY long position i the area now.
XLE 30 min, again if you want to know where the divergence is look at the bottom of the chart for the red box around dates, before that we had good confirmation of the uptrend.
When looking at a 3C chart, the quality of the confirmation signal is just as important as the divergence, it's telling you something about the quality of the overall signal whether bullish, bearish or confirmation of the price trend.
XLE 15 min with accumulation in early November, the shorter timeframes will have more detail than the longer ones.
The 5 min chart shows some great signals, even a short term accumulation signal.
Energy 2 min, this speaks more to timing than the strategic outlook of which way I want to be positioned.
The Daily Trend Channel stop that definitively clears out the long trend.
The leveraged ETFs
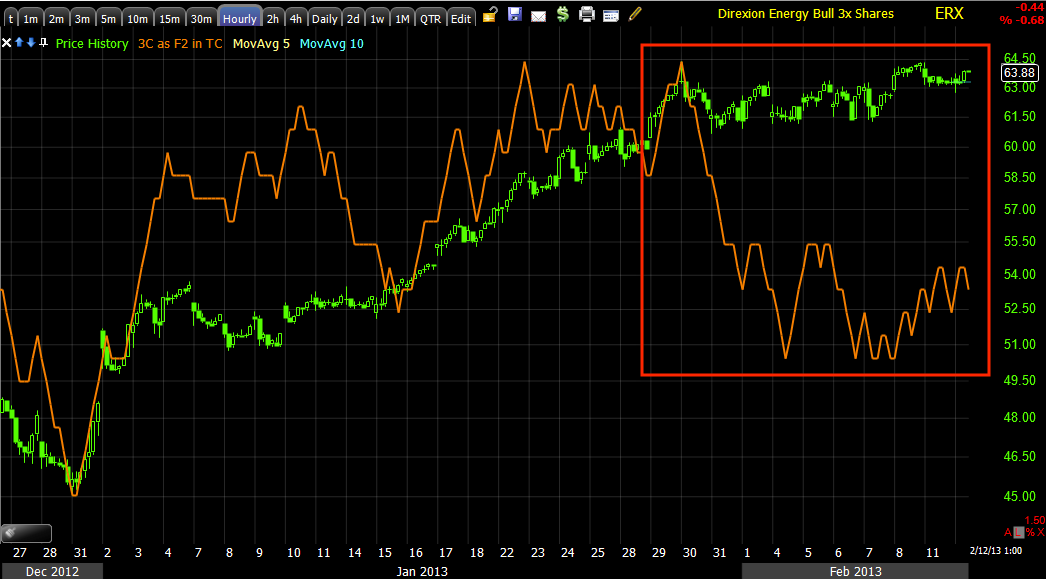
ERX 3x long Energy 70 min looks similar to XLE 60 min
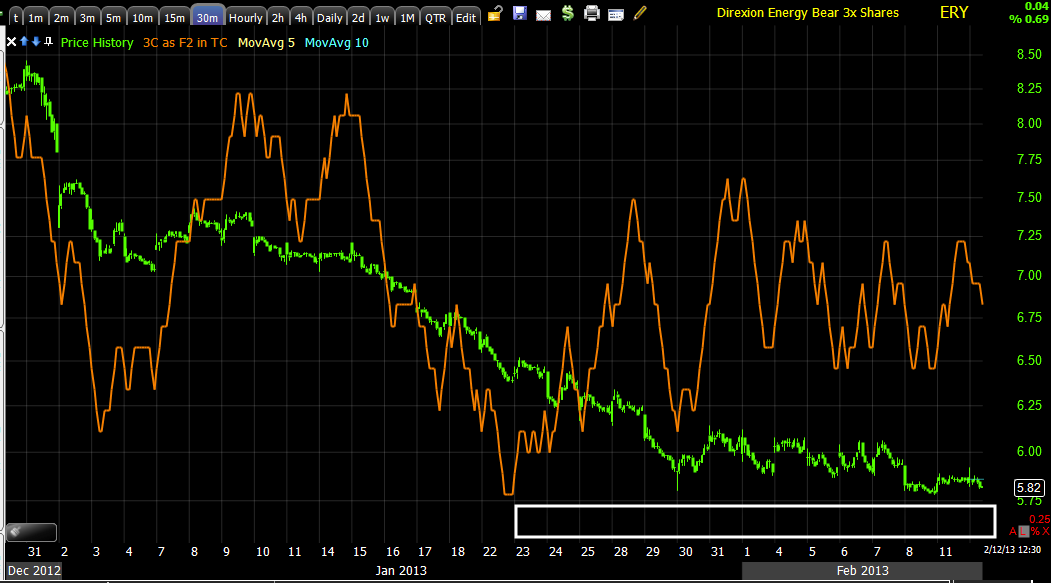
ERY, 3x short energy 30 min is a leading positive divergence, the exact opposite of XLE's 30 min chart.
ERX 3x long Energy 10 min chart is leading negative after confirmation.
ERY, 3x short Energy 5 min chart is leading positive
As for a potential stop, the Trend Channel figures out the normal volatility of the stock it is applied to and adds a certain formula of a standard deviation both above and below the media volatility, so with a stop (meaning ERY makes a beautiful long) at $6.11, I'd personally take the difference between $6.11 and the current price of $5.82 and subtract the difference to come up with my initial stop ($5.53).


No comments:
Post a Comment