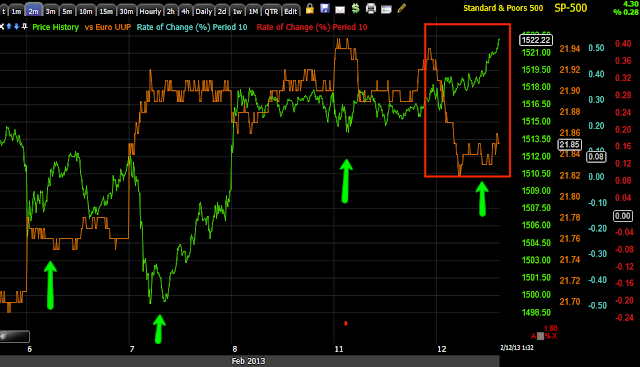
A couple of interesting things have happened, last week and Sunday night I said I thought the market would be dominated not by the VIX which has been the lever of choice this year, not by AAPL which was the lever of choice for many years, but currencies would be the pivot everything revolves around.
Second I showed you High Yield Corporate Credit's 3C positive divergence over the last week I've shown it almost every day and said I thought it was a shakeout move getting ready, the initial information coming in right now is that is correct which is not good for the market.
*Remember the comparison symbol is always the SP-500 in green except when otherwise noted)*
Commodities vs the SPX for whatever reason decided not to play along on the attempted risk ramp, a quick look shows the precious metals are pulling back here, but the larger commodity move has lasted all day.
Commodities vs the $USD in green (not the SPX), in white to the left we have the normal $US Dollar/commodity relationship, today even with a $USD slightly down, commodities are risk off whe the normal correlation would not only to move opposite the $USD, but with a risk on move if it is strong and real like the SPX/market, they didn't follow.
FCT as a smaller, but still notable indication showed no movement to the upside at all with the ramp, which isn't much of a ramp at +0.25%, but it's more than the last 2.5 days.
FCT's larger negative divergence with the SPX on a 5 min chart.
Junk credit moves like HY Corp (HYG), so it's up with the SPX.
Longer term though as I said, it would have a lot of work to repair this big of a leading negative divergence.
High Yield Corporate (HYG) doing the same thing, it has been down so hard for so many days, I have suspected a shakeout attempt of the shorts.
HYG's longer view, leading negative divergence,
This 3C chart of HYG (15 min) is the one I've been talking about for more than a week, it' also what I believe is a stop run or short shakeout move,
As the move started the 1 min chart in HYG went south, which means that distribution of the position which must be decent size by now, started immediately at the first sign of higher prices, this again suggests a shakeout move.
That chart so far migrated to the 2 min chart, it's now negative on the 3 and 5 min charts as well so there's good migration.

High Yield Credit actually sold off and went the opposite direction rather than running with the SPX.
The Euro lent support, but I don't think this is the key.
Euro on a longer basis as the $USD has shown strong upward momentum recently (that pressures stocks and risk assets).
The $AUD is still leading negative below the November 16th cycle lows, but was in line intraday.
The $USD helped the market by showing some intraday weakness, all of the green arrows show the normal $USD/SPX or market correlation, they trade opposite of each other.
However, from timing, from the look of the move, I think the key is really the key currency, the Japanese Yen, it saw weakness and the market lifted at the same time. This is the one.
All in all, there's not much strength here in leading indicators, just currency correlations.


No comments:
Post a Comment