I've looked over these as well, even though they are more useful later in the day, the one constant tends to be the overvaluation of the S&P futures, whatever the differential is, we see this just about every day now for the last several weeks.
ES trading above the implied value of the CONTEXT model based on other risk assets.
Going through leading indicators was about as frustrating as the charts of the averages, it's almost as if the market is truly on the fence short term. I couldn't find anything of value, except what I mentioned last night about the Yen, here's what I found there (generally speaking a rising Yen is not good for carry trades which is not good for the market).
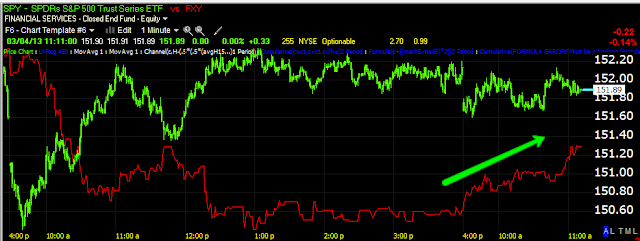
The SPY in green vs the Yen in red from last week in to this week (present), the Yen has been in a multi-month downtrend, this is one of the first times that trend has been questioned with lateral trade or even moves to the upside.
Last night I showed you this 5 min chart of Yen Futures with a positive divergence and the Yen heading up, it slipped down late last night and formed a kind of "W" bottom and has another leading positive divergence with another move higher than last night's.
It's pretty strange when you can look at so many charts and get so little out of them.
Is interest rates about to start going up?
-
Yes, I know - it does not make any sense - FED is about to cut
rates...but....real world interest rates are not always what FED wants it
to be.
6 years ago


No comments:
Post a Comment