I'm getting a lot of emails about UNG's move today and the possibility of a breakout move coming, it's just easier to post an update than try to explain it in numerous emails.
Here I'm trying to represent UNG's move down to the move toward accumulation and the move up and moving out of the basing area, today it just so happens to be right in the area of a breakout.
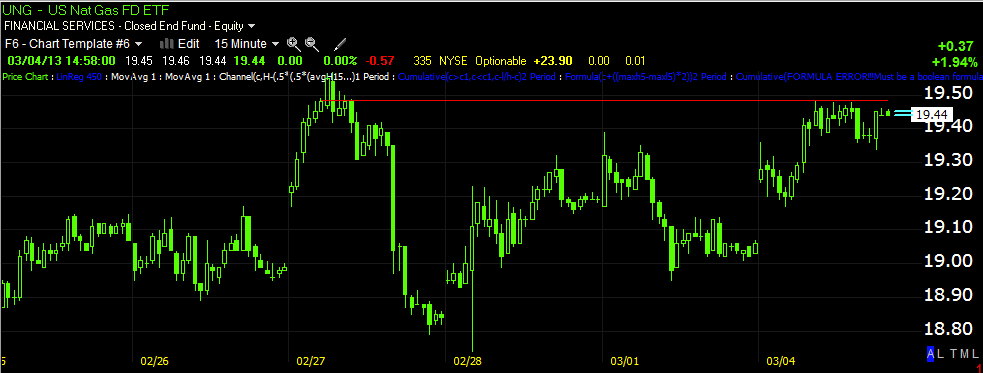
Here's a closer look at more local resistance, although it stretches back a little further. Whenever UNG has needed some extra gas to push through resistance it has pulled back to collect it.
This is just meant to show there's very little movement on the 30 min chart, it's nearly perfectly in line with the price trend or confirmation.
The more important hourly chart leaves me little doubt UNG will push through this resistance, I'm not convinced it will do it today or tomorrow though.
The shortest chart at 1 min looks almost exactly the same as the 30 min chart, it's almost perfect symmetry between the two flows, one will have to give way at some point, with plenty of room to pullback without doing any damage, that's what I'd think is most likely, but I personally would not try to trade around it, UNG has given us a few major upside surprises before and as I said from day 1, this is a longer term position.


 | Theme by Thur
No comments:
Post a Comment