Remember my
"Think Like A Crook" (i.e. Wall Street) that I have been posting lately, it's what you have to do.
The negative divergences are real, they are showing distribution, profit taking , short selling, all the things that this move was set up to allow large positioned Institutional money to do. However, there's always the chance of the "AAPL Episode" where some big fund decides,
"He who sells first, sells best" and dumps in size on the market, that sent AAPL down about 40% and over 300 points in several months as discussed in further detail last night, so the gatekeepers are having to pull levers.
We use the SPY Arbitrage from Capital Context to get a broad idea and then confirm and narrow it down with out Leading Indicators layout. Here's the definition of the actual construction of the SPY Arbitrage model right from Capital Context...
" Capital Context has created the ‘SPY Arb’ model which identifies a tradable relationship between the stock market (SPY) and its value implied from interest rates (TLT), credit risk (HYG), and volatility (VXX). "
The model, although 30+ mins delayed...
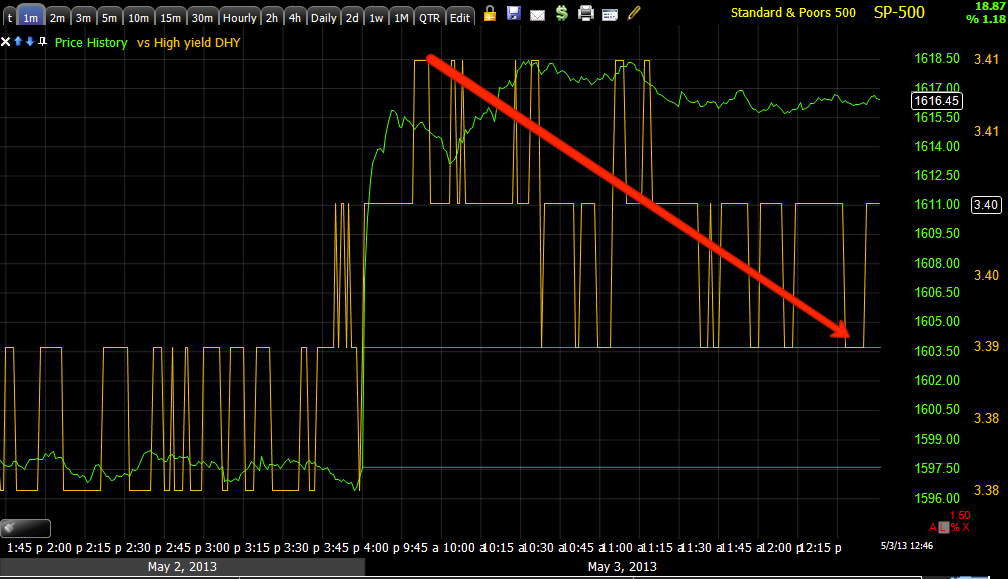
As you can see from the Histogram of the model vs. the SPY, the levers of intraday manipulation (HYG, VXX and TLT) are being pilled because of the distribution which is naturally pressuring the market, but other things are as well and if my "Think like a crook" view is right, they need to defend from a bad downside move.
The Euro should move with the SPX, it is falling off, I mentioned it in the futures update, this is causing negative market pressure and from what I see now, it doesn't look like this is going to get better as the positive Euro divergence can't hold.
The move up in the $USD is market negative-actually almost all risk assets, again, there are divergences here, but nothing I'd bet on.
High Yield Credit, as expected is first mover because of liquidity issues (it has very little) and is negative, this isn't good for the market overall as credit tends to lead and equities follow, here's a good example with the same asset vs. the SPX.
HY Credit leading positive in white sends the SPX higher, HY Credit starting to lead negative, this is what we need to see really head south.
In addition, one of the actual levers itself and a VERY liquid way to trade HY Credit (HYG) was market negative in red-compare the timeframe to the SPY Arb. chart, you can see they are pulling on this lever to the far right. They are trying to hold the market up/send it higher if possible.
Here another lever, TLT breaks lower while the SPX DID NOT make a new high, that's the lever being pulled.
Volatility is going the other way in the white box to the left-check the time vs. SPY arb, protection is bid and outsized vs. the SPX move to the left, to the right VXX is a bit suppressed so I think even it is being used.
This is about getting the timing right and being in the right spot.


No comments:
Post a Comment