These are the charts that were meant to follow the first post, named "Important" because I wanted to make sure it stuck out. There are a few sections below in red, meant to standout. Please do not take this as a criticism if you feel like, "He's talking about me", I'm not talking about anyone in specific, I'm talking about a much bigger concept than that, I'm talking about the fact that Wall St. doesn't do anything without a reason (as I gave you an example of earlier).
The reason for moves like today are more emotional than anything, meaning the ultimate move as we have expected and now have data to support, is a much bigger move than today, however the two forces that move the market are quite simply Fear and Greed; if you want to trade you are better off majoring in psychology than economics.
The areas in red below point out that you (all of you) are not part of the flock of sheep, you've made the choice to turn off CNBC, to look at the market with new eyes and see the way the market really operates. You know these moves are strong and at this point have to stronger than ever because they need to change wildly bearish sentiment to wildly bullish sentiment if the set up is going to work, for that to happen, the moves have to be believable and even you, even myself, sometimes get caught up in second guessing even though we knew this ahead of time and knew to expect it, that's just human behavior and that's why these concepts are so powerful, Wall St. is engaged in psychological warfare. In closing this topic, please don't take anything below in red personal, it's not about anyone I can even think of off the top of my head, it's just an example of how powerful these moves are and how Wall St. always has a reason to do something.
Moving on, I know you have heard it often lately, "I've never seen something like this before", but we are in an extreme market that is a house of cards, built 20 stories high, built on beach sand with shifting winds and an incoming tide (That would be the market's movement based on F_E_D liquidity that is about to be withdrawn).
The point is, we've never had a market like this in the history of the world, not only so interconnected, not only so many global recessions, but something like 500+ International Central Bank easing actions since 2009, it is truly unprecedented and you can see how it is playing out in Japan already, that's a preview.
OK, this is what I have so far. Please don't forget that in my theory of what would happen in the market posted a week and a half ago last Monday and Tuesday, the triangle in the averages was a head fake pattern set up to draw in shorts, shorts were to be burned causing a squeeze to the upside, the reaspn for the last week and a half of trade was to set up a strong upside move, when I say strong, I mean strong. I often warn ahead of time something like, "This move is going to be so strong you yourself with all of the knowledge you have that others don't, will feel fear"
Even after giving members wanrings of what to expect, even after telling them that this move will be so emotionally strong and challenging, you'll be moved, I STILL GET PANICKED EMAILS FROM MEMBERS WHO THINK THE MOVE WE EXPECTED AND WERE WARNED ABOUT IS A REAL THING AND THEY WANT TO UNDO EVERYTHING WE HAVE DONE TO TAKE ADVANTAGE OF IT.
I'M TELLING YOU NOW, THIS UPSIDE MOVE SHOULD BE ONE OF THE STRONGEST YOU HAVE SEEN, YOU WILL DOUBT ALL SHORT POSITIONS AND LIKELY BE AFRAID TO SHORT ANYTHING, ALTHOUGH THAT IS THE PURPOSE OF THE MOVE.
Just like the move of the last week and a half was to set up a bear trap to push prices higher and we haven't even gotten started yet as far as I can tell, the next move will do the same thing, except it will be drawing in bulls to establish a huge bull trap for a wicked break to the downside.
That is what I have thought since that Monday/Tuesday last week, I have not wavered since then and I am now getting the evidence that supports the theory.
*IF ANY OF THE EVIDENCE CHANGES (and smart money is not always so smart and reserves the right to change their mind) I WILL WARN YOU OF ANY CHANGES.
Now the charts...
Lets start with the Equity Index charts (ES is the S&P E-mini futures, NQ is the NASDAQ 100/QQQ E-mini Futures, TF is the Russell 2000 E-mini futures.
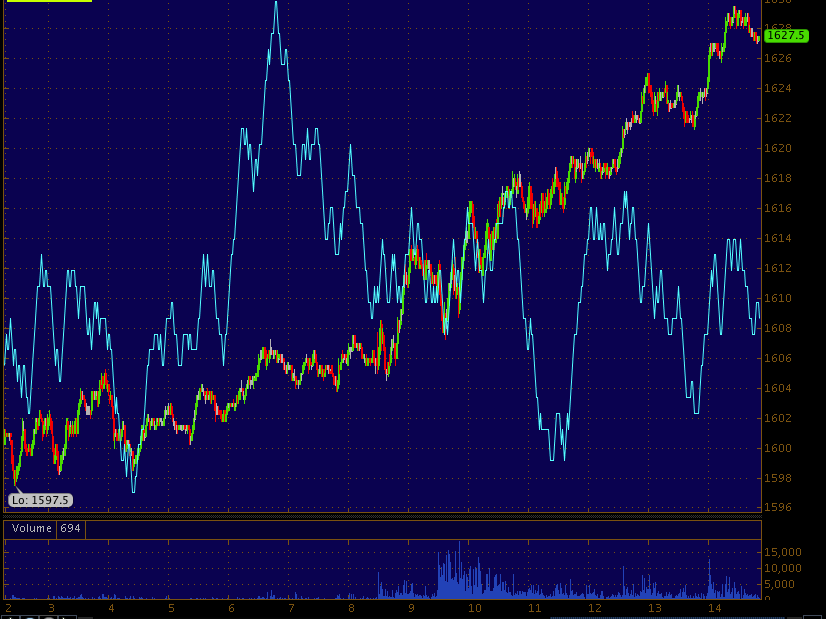


Note the previous low/positive divergence, it's possible this is one large divergence in which case, the move would be exceptionally strong.


As for currency and if you haven't read the two articles I wrote in April "Currency Crisis" which are both linked at the top right of the member's page, then you are missing out on a lot of understanding of what is happening, why and what it will lead to.

Today...

We also had the EUR/JPY

The USD/JPY which is the main driver of the market right now...

The same negative intraday was there so I decided to look at the individual Currency futures and found more surprises.

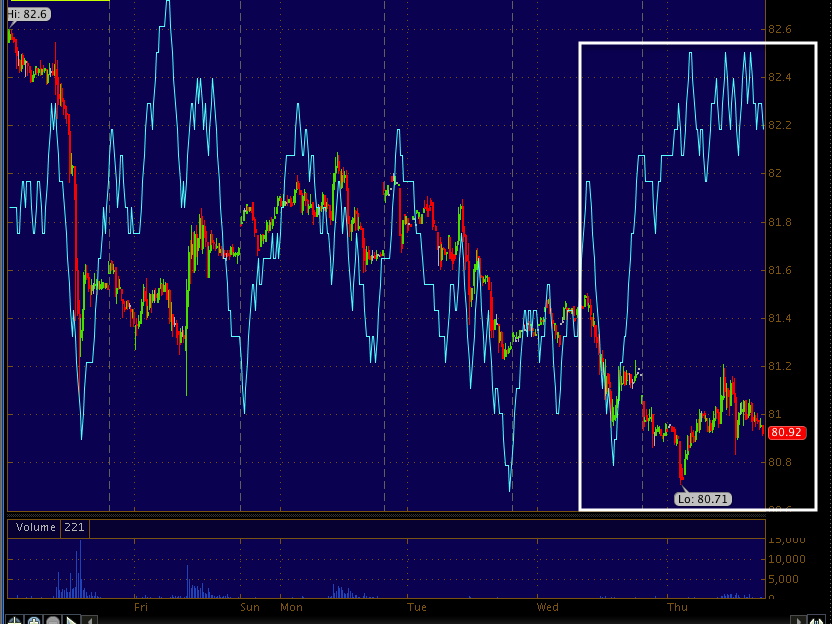
Now the Yen...


This is the 4 hour Yen, the VERY big picture, note how it is the opposite of the 60 min, if you read the two linked posts, Currency Crisis, you know what this means, this is the trend that the market upside and bull trap are setting up.
More shortly.


No comments:
Post a Comment