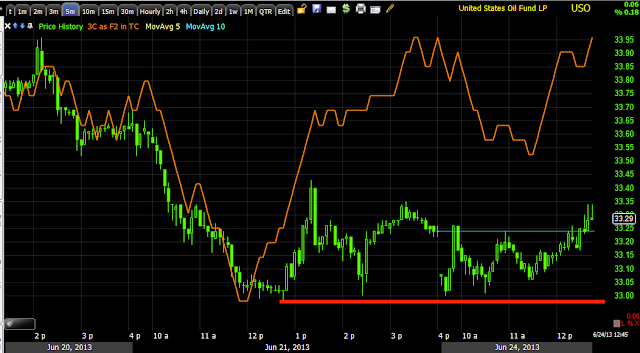
Here are the charts. I was talking with a member about 3C over the weekend and I explained that I would not expect to see any counter t rend (like market up) moves see large positive divergences in the 15, 30 or 60 min range.
If I'm thinking like a crook, then most of my portfolio is already and has been positioned to the short side, (again I'm thinking like a crook), I have a large fund, large AUM and it takes me a while to enter any position or close a position, I want to enter say a short, as the market is moving down or sideways after a move down because that's where I can find the supply to accumulate from sellers and short sellers.
However, I'm expecting a massive flush in the market after this move, I can't be sure who in the Hedge fund heard might break ranks first and be an all out seller in to any strength and I don't want to be caught with a large position that I not only can't sell in to higher prices and demand, but I don't want to be caught trying to offload a large position in a market that is nothing byt asks, no bids- I'd only see my position drop in a big way. So, while I'll play the move (bounce), I'm not committing to anything I can't easily unwind quickly. Thus, I don't expect to see larger positions accumulated which would be on 15, 30 and 60 min charts.
USO 2 min with a large leading positive divergence, this makes the drop in USO look like a sucker's move, a head fake, it created supply on the market that could be accumulated and that's what it looks like they did, seemingly very purposefully, planned last week or well before.
3 min is spectacular in its leading positive to a new high for the chart as prices are near the lows of the chart, that's a LARGE positive divergence.
5 min chart leading positive, for the 3rd time today I'm showing you a concept we have held for a long time, accumulation after a down move tends to happen in a fairly tight and flat price range, if you don't understand why, think about all the logistical issues with trading a several hundred million dollar fund, even multi-billion. Also consider the market makers and specialists that fill these orders as they know the stock better than anyone a they make a market in it every day all day. They are judged on the position price they put together by VWAP, so they want to accumulate near VWAP and knock prices down when they move too far from VWAP, they have no problem buying under VWAP (that's even better), however other professionals see the flow and they are doing the same thing so in this case, there is an economics 101 principle of supply and demand, demand is what gives the range support.
VXX short or UVXY short, you can also play the same position by going long XIV, although that is not leveraged (like VXX), but volatility or VIX futures are very volatile so they need the least leverage of most risk assets.
VXX intraday going leading negative, again for the 5th time today, note the range in price as distribution occurs, the same logistical principles apply, only in reverse.
VXX 5 min leading negative, there's been damage here well before today, it just seems today there;s an understanding prices won't be at this level for long so there's a lot of movement which shows up on these shorter intraday charts as extremely impressive looking divergences.
UVXY is the 2x leveraged version of VXX, again the idea here is short UVXY or long XIV, but it doesn't have the 2x leverage.
UVXY with a large relative negative divergence and a leading negative as well.
Is interest rates about to start going up?
-
Yes, I know - it does not make any sense - FED is about to cut
rates...but....real world interest rates are not always what FED wants it
to be.
6 years ago


No comments:
Post a Comment