Where do we start? Lets start at the beginning.
We assume the conventional wisdom is in play until its not, that would be all bad economic news is good news as traders (I believe mistakenly feel, bad economic numbers will stay the F_E_D's hand from tapering/ending QE), then today defied conventional wisdom early on.
Overnight I posted this futures update... The gist...
"As far as the Yen goes...It's no wonder the Yen crosses look like they're coming down, at this point I have to wonder which FX cross can power any market upside, it's not looking good, except for a very short term overnight move perhaps in the EUR/USD."
In other words, with no risk pair to drive futures, what would? Apparently nothing as you saw by my first early futures update this morning.
As far as Treasuries went last night...
"10 Year treasury futures are in a small triangle overnight, I wouldn't be surprised to see a head fake/ false breakout of the triangle to the upside, but after that both the 10 year and 30- year US Treasuries look like they are coming down"

This is the current 10-year Treasury / 5 min 3C chart.

10 year T's are still leading negative, but we expected a drop in T's from about a day and a half ago as divergences in TLT became evident. In my opinion at the time, the fall in TLT only needed a little boost in HYG to drive upside risk on action as the currency crosses (risk) were not going to do it as was clear last night.
As you know, I think a pullback in TLT is a gift, we should be looking at TLT and some sort of leverage as a longer term "Core position" on the long side.
Finally finishing up the post...
"As you saw in the averages today, there's a ton of damage where it counts"
What did I mean?
Still some are puzzled by the 600 point drop in the Nikkei 225 futures tonight. As I said today, "I'd want to have at least a good portion of my short exposure in place". Why? Because the Nikkei futures took out 5-days of gains in 30 minutes. THIS IS EXACTLY WHY I CAN'T ADVOCATE TRADING AGAINST THE UNDERLYING THEME OF 3C, I'VE SEEN ALMOST 2 MONTHS OF LONGS WIPED OUT ON AN OPENING GAP!.

NIKKEI 225 Futures tonight, down about 600 points from earlier highs.
So conventional wisdom about good being bad and bad being good didn't hold up as Initial Claims were released followed by the Philly F_E_D, both better than consensus.
A closer look starting with Initial Claims...
Consensus for IC this morning was 345k, the previous week was revised down to 358k, this week's print came in beating consensus and dropping from last week's downwardly revised print at, 334k!
However, dig a little deeper and Unadjusted Claims stood at 409k vs previous 383k, you can thank the "Seasonal Adjustment".
DOES ANYONE NOW HAVE ANY DOUBT AS TO WHY THE F_E_D / F_O_M_C changed their QE yardstick from Calendar guidance to "Economic reports"? The first is objective, it's a date the market can count on. The second is subjective, it's economic numbers that can EASILY be manipulated giving the F_E_D a face-saving way out of QE, it became obvious long before they even mentioned the idea of the change, but the change in my mind way back then if you recall, sealed the deal, the F_E_D was looking for a way out.
Continuing...Continuing Claims were up 91k from last week! The print of 2.953 mn two weeks ago saw its largest 2-week rise since February of 2009 with today's print at 3.114 mn!
So the headline print in Initial Claims looks great for headline scanning algos, but dig a little deeper and something is truly fishy.
Add to that the former head of the BLS (Bureau of Labor Statistics) came out and basically said the unemployment rate is a farce.
"Keith Hall believes the US economy is a lot sicker than the 7.6 percent unemployment rate would lead you to believe.
Hall was, from 2008 until last year, the guy in charge of Washington’s Bureau of Labor Statistics, the agency that compiles that rate. “Right now [it’s] misleadingly low,” says Hall, who believes a truer reading of those now wanting a job but without one to be more than 10 percent.
The fly in the ointment is the BLS employment-to-population ratio, which is currently at 58.7 percent. “It’s lower than it was when the recession ended. I think that’s a remarkable statistic,” says Hall, a senior research fellow at the Mercatus Center at George Mason University in Fairfax, Va.
That level tells Hall the real unemployment rate is actually about 3 percentage points higher than the BLS number. Suddenly 7.6$ Unemployment becomes 10.6% because manipulating the labor force participation rate is so easy and then there's alway the monthly seasonal adjustment to fall back on. THIS IS WHY THE F_E_D CHOOSE IT'S MANDATE AS A FACE-SAVING WAY OUT OF QE, IT'S THAT EASY TO MANIPULATE!.
As to the U-6 rate, about the same way unemployment was measured during the Great Depression, topping out at 25%....Hall reckons there are millions of U-6 people on top of the 4.5 million long-term unemployed. "This has been a very slow, very bad recovery,” he says. “And I think the numbers have really struggled as a result. In fact, I’ve been very disappointed in the coverage of the numbers."
Next we were off to the Philly F_E_D... which came is at a previous of 12.5, consensus was for a decline down to 8, the actual print? 19.8, the highest headline print since March of 2011! WOW, the economy is really improving, a September taper of QE (if not before then or something even more shocking is going to be guaranteed!
However, dig a little deeper and we find New Orders fell from 16.2 to 10.2, Inventories fell from -6.6 to -21.6, shipments surged though from 4.1 to 14.3 and you wonder why the Transports closed up +1.65%, conveniently also the sector used in Dow Theory to confirm the Industrials, meaning it's not just a print to make the Philly F_E_D look better, but more importantly to make the stock market's gains look legitimate.
THE EMPLOYMENT INDEX PRINTED AT +7.7 WHICH IS THE FIRST POSITIVE PRINT IN 4 MONTHS, the Number of Employees Index went up from -5.4 to +7.7.
However the margin squeeze is on, Prices Received less Prices Paid went from -7.9 to -14.5, meaning corporate profit margins are eroding, yet their hiring in quite some size for the week.
Moving along... As you are probably Well-aware, Detroit has filed for Chapter 9 Bankruptcy after negotiations or begging and pleading with the WH failed to secure any Feral bailout.
Right now it looks like the US's 18th largest city by population and the largest municipal default in US History will likely lead to more than a 90% total loss for municipal workers and retired muni workers. Unsecured creditors/bond-holdeers, Unions and Pension funds are looking at an -81% loss while secured creditors will make out the best with about a -75% loss!
THE TRULY SCARY THING? This could be precedent setting and a model for a majority of US cities facing budget short-falls.
As you probably already know, both (our core short) GOOG and MSFT missed on both their Revenues and EPS; MSFT should have been predictable after INTC last night.
Yesterday's (Wednesday) GOOG Update, " These are the exact same trendlines I drew in on the last update, the areas I would consider looking at a GOOG short because they were bound to be hit....if I was using excellent risk management, this would probably be a pretty nice area to start building of continuing to build a phased in position "
And the sector winners this week? Get ready for an oxy-moron, Financials and the safe haven Utilities. It seems the latter is being bought while the former is being sold/shorted. As you know, XLF is right near the top of my list, I've already picked the Put contract and of course ready for the FAZ long as soon as a couple intraday charts fall in to line.
The QQQ Aug $76 puts opened yesterday are at a +30% profit already today, this is what I mean by, "Take them when they are ready", not all assets will be in the best position all at once, we still have a tiny bit of rotation left in this market as the disparity between the NDX and R2K couldn't be more glaring as well as the week's 2 gainers, Financials and Utilities?
As far as other indications today...
With no real currency risk pair in the driver's seat today, I suggested last night and the day before the SPY arbitrage would drive the market to a large degree (the IWM/R2K did as well if you recall the intraday updates today). It was known several days ago that TLT (a SPY arbitrage asset) would be pulling back, I believe it is coincidental, but coincidental or not, all they needed was HYG to stay flat or gain for a positive SPY arbitrage which they got.

It'd pretty clear the SPY Arbitrage was working today.
TLT was contributing, but I think this is as I said the other day, "If you are institutional money the last preparations you want to make before your trip is to sell short or any long exposure left in to higher prices and move in to safe haven assets like Treasuries". I also surmised (not a hard one to figure out), the the losses banks are taking in unrealized gains (losses) in their "Assets Held For Sale" due to treasuries plunging has 1 simple answer, it can be summed up in a question. "How do you drive investors in to Treasuries?"
It just so happens that ending or tapering QE is going to have the same effect.
Back to TLT/Treasuries where I think the case in underlying 3C trade is much more bullish than people think, smart money is apparently in the right place, but they don't want to stir up any suspicions, just look at the action, also check last night's futures update and specifically 30 year treasuries and their 4 hour 3C chart.


On pullbacks, we want the trade to come to us (if we want to go long), we have to confirm though that there is accumulation in to the pullback, so far so good in TLT, although it has some more downside, which means whatever is happening in futures tonight / earlier, I don't think the market is ready for a crash tomorrow any way, plus is op-ex Friday and Treasuries aren't at the accumulation zone where they pick them up in bulk.
The only other asset needed was VXX to move down or HYG to move up as they are the 3 arbitrage assets...


Remember that Junk Credit trades almost exactly like HYG, except it was the first to give us a clue that the distribution there meant they weren't interested in holding a risk asset, it's for effect only (arbitrage).
Unless the market just loses all control, another reason I think we have a little more time (not much) is the High Yield Credit chart.

HY Credit vs. the SPX even intraday you can see why they say, "Credit leads, stocks follow". However HY is illiquid vs HYG so this will break down fast and hard right before a market waterfall, just like the time a couple of months ago it went from nearly new highs for the year to erasing all the gains in 2-days.
As for the recent VXX Aug. $16 call, it's only down -12%, the only thing I needed to see to feel good about the position was intraday accumulation as the long term is already there.


However, here's the reason you can tell traders were scared and buying protection even without 3C.

This is the VIX in blue vs the SPX, they should trade opposite each other, however I inverted the SPX's scale to show where the VIX was seeing outperformance or "Traders buying protection" now that the July contract expired Wednesday.
Here's Sector rotation...

Notice a contradiction? Financials at the bottom are in rotation and so are the "Flight to Safety" Utilities sector. A Risk-on/Risk off day among the sectors.
At this point it's more about positioning than anything and choosing the right tool for the trade. I will close remaining shares of MCP, hopefully in to some intraday strength, but I want to get that gain totally off the table. You won't think I'm sane, but I think we can get away with a quick weekly Put trade in MCP and AAPL as long as we get the timing right. You know a lot of the assets I'm looking at, but tomorrow I'll be spending most of the day going through all of my pre-scanned watchlists, (Stocks> $5, option-able, decent volume, and of course 3C patterns).
As far as commodities, I'm interested in Gold and Silver (GLD/SLV) longer term, but as I said earlier in the week, they both need to pullback, build a bigger base and move on a counter trend bear market rally (at least in GLD's case). For now, I think patience is the best option, I wouldn't short these waiting for a pullback either, they're very QE sensitive (gold more so).


The white zone is the accumulation zone, as always though we want confirmation.


As for crude/USO, the put is a bit painful right now, but I have faith it will come through.


The intraday trend is very clear that there's strong distribution, note to the left there was near perfect price/trend confirmation.
As for futures...
The Nikkei futures look like they are building in for a surprise bounce, the 5 min futures never went negative so it seems there's a lot of volatility and shaking the tree, we should see lots of Crazy Ivans, but that also means we're in ear shot of the rushing sound of the falls.

After that vertical decline and a triangle (Bear pennant) most technical traders will be betting on a continuation move with a downside break to a new leg lower. 3C and market manipulation behavior suggest a break to the upside is much more likely.
As for the US Index futures, ES and TF are trending down and in line, but NQ (NASDAQ 100 futures) have an interesting feature. Remember that Thursday closes tend to be close to Friday op-ex opens.

Looking at the 5 min chart below...

This one never confirmed the downside move so I'm expecting a lot of volatility. We always want to be ready for the AAPL scenario when a group of hedge funds breaks from the herd and takes a "He who sells first, sells best" attitude and then all of them try to fit out the same small dorr at once, in AAPL's case sending it down 45% in 8 months, but from what I see, we're going to see volatility for now and we can use that to our advantage.
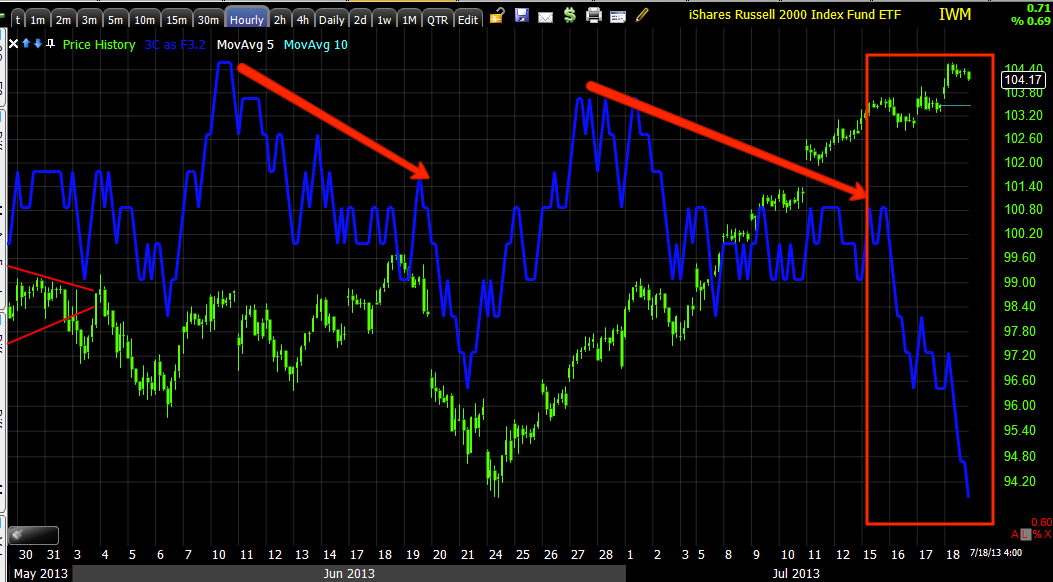
Some of the positions, if we get them, are going to be emotionally difficult to enter, they'll be shorting in to new highs or strength (3C weakness), just remember Bernie's favorite average, the R2K and this hourly chart, this should remind you of what's coming.

IWM 60 min.
I'll see you in the a.m.


No comments:
Post a Comment