
The flat range is boring for traders, its where they let their guard down, I call it dangerous and describe it as, "The kids in the room next door being a little too quiet, YOU KNOW THEY ARE UP TO SOMETHING"
One of the scans I'm working on for 3C divergences is flat ranges like 2004-nearly 2007, that's a LOT of accumulation in AMZN and 3C shows it clearly. The bigger the base, the bigger the move it can support. 2007-2008 are probably just victims of the general market tone. 2009 is where we saw MASS ACCUMULATION among almost every risk asset as QE1 went from MBS only to adding Treasuries around March of 2009.
There was distribution @ 2011, I don't know why, but it knocked price down and was accumulated again in 2012. The relative divergence between any point in the past and price/3C levels now show a large relative negative divergence, or you could say there's much less underlying capital flow in AMZN at higher prices than at significantly lower ones, distribution.
The yellow area is the 3 target zones I waited for before initiating/adding to AMZN short positions, I believe one was > $282.50, another around >$287 and finally the psychological level of $300. THIS WAS/IS A PURPOSEFULLY "PHASED IN POSITION" and is a "core short".

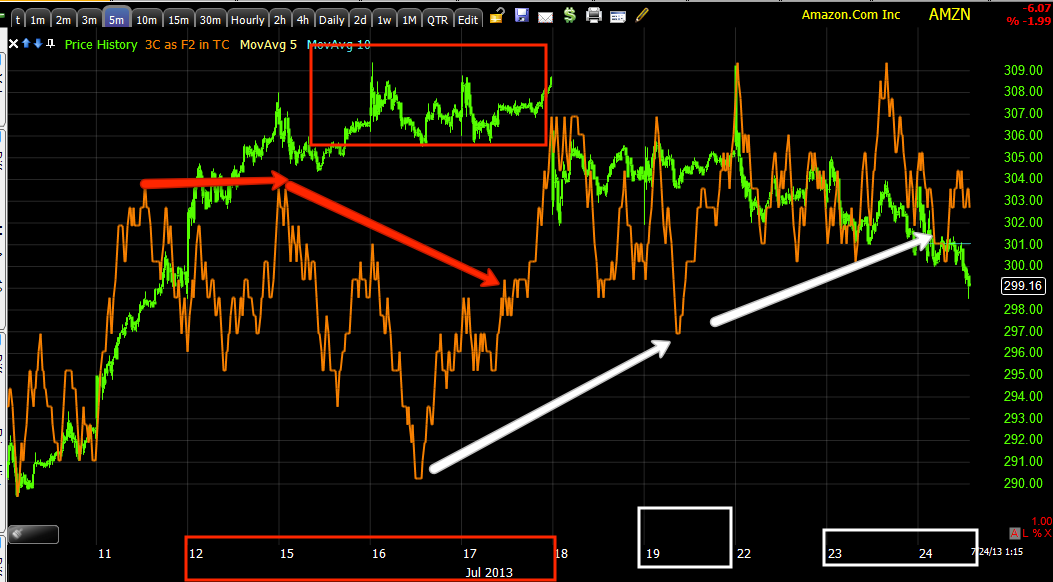
3C and price are as they should be at the green arrow, before that you can see the preparations being made to accumulate AMZN below the range so it can be sold above the range, the same thing I'd do, but faster because we deal with 100 lot positions, not 100k or even million shares.
As expected, above the range where retail will bite, there's a leading negative divergence and very fast, VERY DEEP, nearly to new lows on the chart despite price just off the highs.


I just showed you distribution on 30, 60 min, 4 hour and daily, this is the big picture. THIS IS WHY I HAVE PHASED IN AND AM PRETTY MUCH DONE WITH LONGER TERM PREPARATIONS, THERE'S ROOM TO ADD HERE AND THERE, BUT FOR THE MOST PART I'M DONE.
Now the near term trade...

Short term...

Look at the volume (stops triggered) as the bar closes at $299.97, this is how predictable technical traders are. This also gives anyone who needs volume, extra supply to accumulate,


No comments:
Post a Comment