Mostly I've been looking at different assets and seeing if there are any nice looking trades, not just short term leveraged trades, but the prize trades, CORE positions such as AMZN mentioned earlier. I'll be finishing this last watchlist and then transferring to more market analysis and setting alerts for a number of positions that are in perfect strategic areas, but are just shy of the tactical entries we want, which honestly, when looking at the big picture, matters a lot less.
BEAV is another core short position, one I've been building and we had a chance to add not to long ago, this is one that I don't see coming back to a great tactical entry, I think that passed, but it may offer a better entry.
This trendline had been on the chart already, it's very clear what I was looking at and what the plan for opening or adding to a position in BEAV was.
There's clear resistance at the red arrows, that creates a range and an area technical traders can congregate their orders (mostly breakout trades and sentiment was different then as well). The yellow areas are EXACTLY what we are looking for as tactical entries, they have to be head fake moves above resistance, that's where we get the best entry, lowest risk, highest probability.
Here's the area on a 60 min 3C chart, the two breakouts are clearly head fakes as the size of the distribution on a 60 min chart is immense.
Taking a look at the area on a longer 2 hour chart more generally, reveals it to be a top and of course the head fake move right before the reversal starts. That's why these are such good markers for timing in any timeframe you trade.
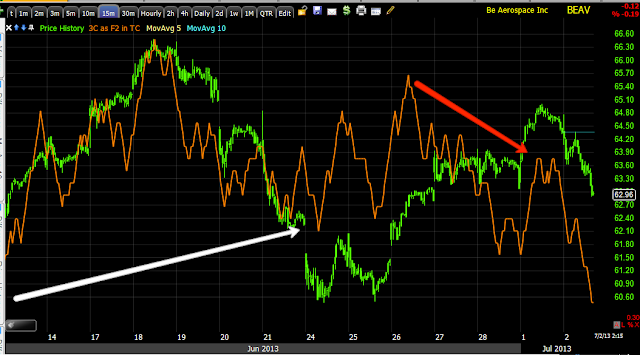
The most recent bounce and failure on a 15 min chart, this is also why I don't expect another move much higher unless it develops really fast.
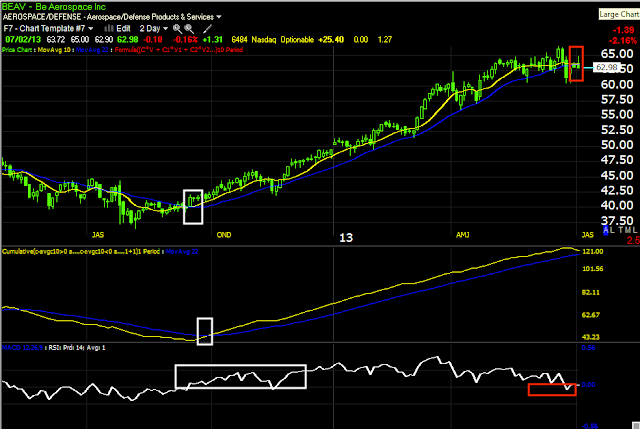
The X-Over system is 2 out of 3 short sale signals on a very long term trend.
And the Trend Channel also on a long term trend shows the increased upside volatility we see before a top at "A", the wider channel at the top as we often see (increased volatility) as well as the flattening out o the channel.
The trend (long term) breaks with a close under $60. The blue indicator at the bottom just shows us where the close was each day within the day's range, it's obviously showing deterioration, but if you didn't move out to a multi-day chart you'd just see noise rather than a trend.
If you have it, I really like it and will hold, if not, it's on the list for a possible entry.
Is interest rates about to start going up?
-
Yes, I know - it does not make any sense - FED is about to cut
rates...but....real world interest rates are not always what FED wants it
to be.
6 years ago


No comments:
Post a Comment