I'm not taking any position on the longer term outlook for gold right now, but I'd say that it's closer right now or in a better place to put together a meaningful bottom that can support a trend of a year or more than it has been at any time since the top in September 2011.
Word is (although it would be difficult to confirm, but not hard to believe) that JPM has received so many demands for physical delivery of gold that it cannot get enough through the normal channels and is actively buying in the open market.
I don't know if that's true, I don't know how long that would be true for if it was and quite honestly after watching Blythe Masters of JPM so skillfully suppress the Silver market for years, it's hard to believe JPM would be chasing gold higher. In any case, that's the word, not that it matters because whatever may be important in that scenario will be long over with before we find out anything useful. It's kind of like traders who try to trade from fund managers' 13F reports filed quarterly, but they can have a 45 day delay so whatever was filed as positions 45 days ago may be long gone or being sold to the 13F chasers.
Which reminds me, just because it annoys me, a reader from my free site Trade-Guild has sent several emails trying to pick an intellectual fight with me and I have been politely leading him to water, but he choses not to drink. So when I posted about the strange behavior in AAPL we noticed way back in February and I suggested Icahn's large AAPL position may have been the cause or part of the cause. I promptly received an email telling me that 13F's are filed once a quarter and if there was activity in February by Icahn that it would have shown up on the first quarter 13F.
I usually have a lot of patience especially with anyone truly interested in the market, in any case the email wasn't very polite and he thought he had me in some iron box and the only thing I could do was admit ignorance. The thing is, with people like this it doesn't matter what you tell them they just want to argue, but I pointed out that the SEC has a provision in 13F called "Confidential Treatment" and it is often used in cases of accumulation especially if the manager has a "plan" and disclosing the purchase would jeopardize that plan.
In fact Warren Buffet used 13F Confidential Treatment to accumulate 5.5% of IBM ($10 Billion) which he announced overnight like Icahn, but the position took him 8 MONTHS to accumulate so Buffet had 2 quarters (Two 13F reports) of IBM accumulation treated confidentially before announcing and reporting it, the SEC website has a section that's pretty easy to read and understand how to apply for "Confidential Treatment", I'm sure Icahn is well aware of it. You don't even want to hear this guy's response, "BLOCKED".
I'm not sure how I got from there to here, but lets go back to gold.
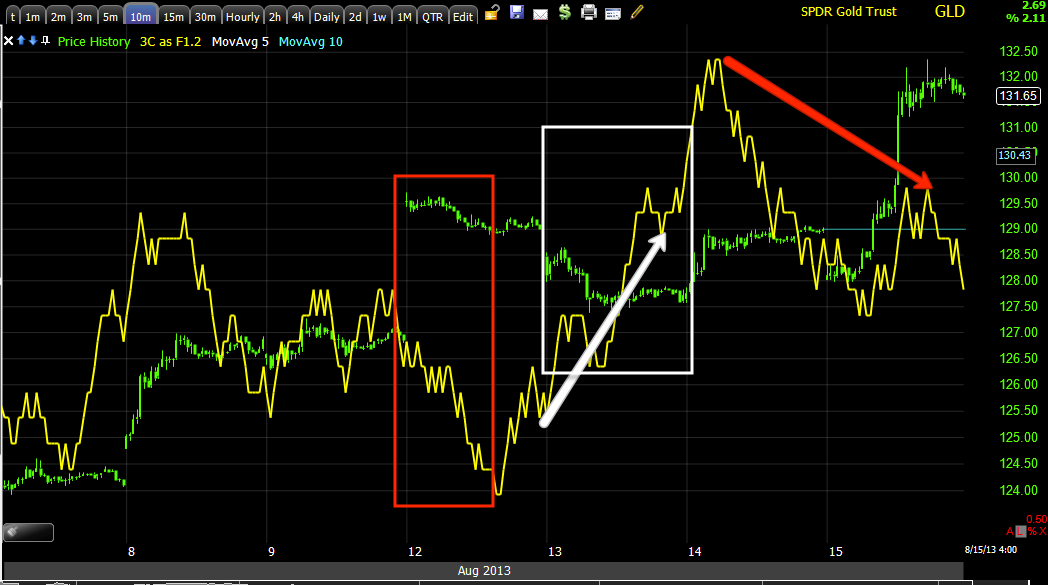
As far as shorter term action, here's the charts for GLD and gold futures.


This is the 2 min chart which is like the 1 min in that when it is put in context, it looks far worse.


If I were JPM, I'd be looking to find a way to knock gold down quick, one of the fastest ways to do that is to get people to chase it in a head fake move, drop prices below the breakout where they would have bought putting them at a loss and the concept of "A Failed move leads to a fast move in the opposite direction" takes over and allows JPM to accumulate what they need at favorable prices- if indeed JPM is still or ever was a relevant issue.


No comments:
Post a Comment