First lets get a grip on where the broad market is and then we'll look at individual assets as the broad market accounts for about 2/3rds of any given stock's direction on any given day.
I talked about this subject last night,
but more specifically Tuesday ,
The second paragraph of the Daily Wrap was as follows,
"
If I had to make a call on a bounce again this week or tonight based on a lot of charts, I'd say it would be very difficult to see any real strong market upside at all, there's very few areas that even have some of the short term enthusiams that has lifted the markets in afternoon trade. Index Futures look especially weak, as a matter of fact the only place I can find any buying excitement in underlying trade is VIX futures and that's not good for the market."
Here are the charts, right now they are VERY superficial, as I was saying yesterday, we need to see all of the averages come together as the QQQ was notably weak yesterday and we need to see more timeframes come together for a bounce, we're still in that situation as of now, except worse obviously.
Some of the charts that were in place and suggested a bounce from last week are simply decimated.
One thing I'll say that I'm happy to see, our core short positions in our equity only tracking portfolios have shot up 9% on the day and put us at a ranking of #50 of 1421 portfolios so we are obviously in the right places.
DIA 1 min and this is about the only place there's any strength in 3C so I'd be hesitant to play it unless other timeframes came together.
DIA 3 min is about as close to in line as it gets.
However as I have been warning about trying to "
Pick up nickels and dimes in front of a steam roller", just on the other side of those intraday charts are the ones that count like this 15 min and they just get worse as they grow more important.
THIS IS THE BIG PICTURE, THIS IS WHY I SAID, "WE ARE IN THE BIG PICTURE NOW, IT'S NOT OFF IN THE FUTURE".
IWM 1 min is leading positive, it almost looks like a small inverse H&S in most of the averages, to get anything really worth taking a chance on here as short term trades go, I think we need to see at least 2-3 min charts go positive as well.
IWM 5 min is now in line
The IWM 10 min is where the bounce signal has been and so far it's still intact, but there's no telling whether the shorter charts deteriorate more or if they can build something to get a toe-hold, either way, it won't last long.
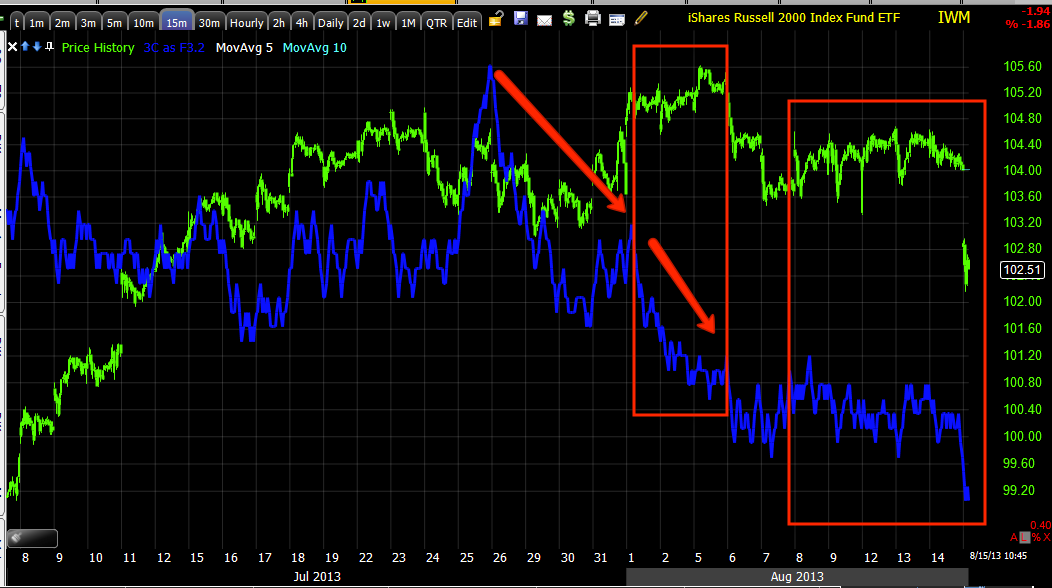
IWM 15 min is just on the other side of that 10 min chart and as you can see, there's a VERY clear difference between a short term bounce signal and a longer term "Big picture" signal.
QQQ 3 min (1-3 are all negative) was weak yesterday, this was one of the main points I was making, Q's and Tech were much weaker than price action looked which sounds counter-intuitive,
but ever since last week they have been using afternoon recoveries to sell in to as we have known for at least a week.
QQQ 15 min is in line, actually 3C is worse than it looks here so again,
we are not "Close to the big picture", WE ARE IN IT.
ODDLY THE SPY SHOWS THE LEAST INTRADAY STRENGTH THUS FAR.
The 5 min chart suggesting a bounce in the SPY (
and remember it has only been one timeframe in each of the averages suggesting a bounce, that's it and the reason why I said "I don't blame anyone for sitting it out").
And the SPY 30 min shows how close the damage has been all this time, you may have seen the 4 hour last night that one member said, "Took his breath away" when he saw it, prompting me to post it last night for perspective.
I'll try to big down in to some individual names and sectors as well as keep an eye on how things are progressing.
All of the Index futures have 1 min positives like many of the averages.


No comments:
Post a Comment