This post does not include Junior Miners, GDXJ, I haven't done enough analysis to include those in with this group.
Yesterday I showed some charts of the gold miners and about an hour later
I opened a speculative GDX Sept. $30 Put or DUST long
That position is just in the green right now, but considering the September expiration,
as of now I see no reason to close it out yet.
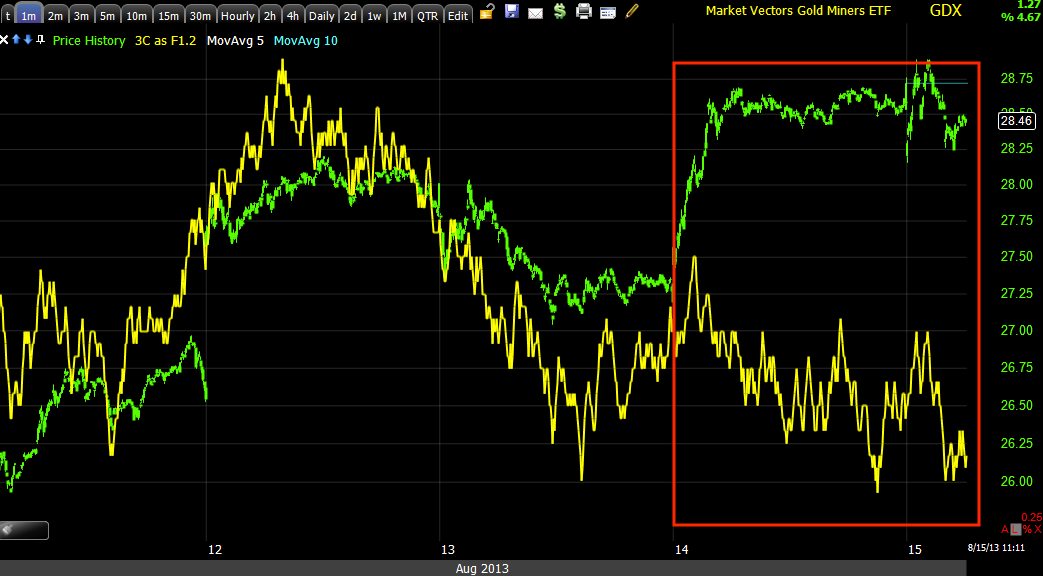
GDX 1 min (NUGT is like being long GDX using an ETF with 3x leverage, DUST is the opposite, short GDX with 3x leverage).
Obviously the near term charts were quite negative which is one reason I liked them yesterday.
This is the 2 min chart, also negative, but a case could be made for some intraday strength at the a.m. lows if you follow the bottom side of 3C higher in to the price lows.
The 5 min chart appears to show the GDX cycle from accumulation to mark up to distribution (next is decline) pretty clearly, also something I like about the Put position or long DUST.
The 10 min chart shows the same cycle, it has less noise and more trend and the underlying trade is clearly leading negative at not only a flat range, but what could very well be considered a head fake "False breakout".
The 15 min GDX chart also shows the cycle and the end of the previous cycle to the left (distribution and decline).
There are longer charts I could use in this analysis, but the fact is this was set up for a shorter term position and I think we have enough here to make GDX Puts (DUST long or NUGT short if your broker will allow it) in place for now.


No comments:
Post a Comment