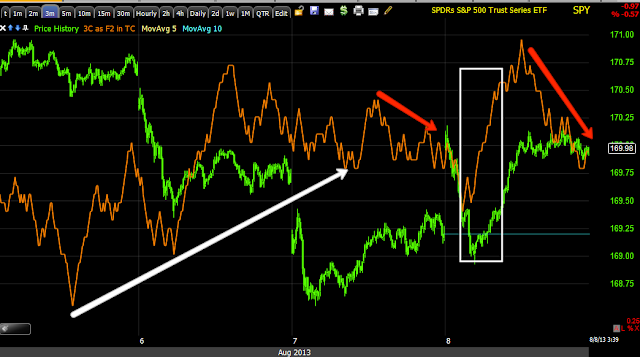
I can't get all of the averages out for you in time to be useful, but just like yesterday's end of day 3C signals told us (not about the overnight gap, that came from something unexpected out of China we'll talk about later) that early trade in the morning would see weakness and we did, the longer signals told us that the morning lows would likely be accumulated and they were, now what has happened since then is something brand new for short term trade, but it's giving us a hint and warning.
SPY Example...
This is the 1 min chart, yesterday at "A" we saw accumulation of the lows, we were starting call positions in this area and cashed some in today, at "B" yesterday afternoon it was telling us this morning would see weakness and at "C", despite the gap up, the market did see that early weakness and I suspected accumulation of the a.m. lows, but "D" is essentially uglier than yesterday's late afternoon signal that played out today in the a.m.,
"A" tells us on this 2 min chart, "Down" and the next day, down. "B" tells us weakness in the morning today and a gap up and weakness, and look at that ugly signal this afternoon.
It's on the 3 min chart too so this is starting to feel a bit more than just "Tomorrow's early trade".
The 5 min chart is still in line so I don't want to short against this chart until it starts to peel back.
However, I know that if I do short, I'll be fine...
This 4 hour chart shows the EXTREME weakness of this run up so this is about putting on the right trade at the right time.
Right now, I think it's time for patience and let the next trade set up.
Is interest rates about to start going up?
-
Yes, I know - it does not make any sense - FED is about to cut
rates...but....real world interest rates are not always what FED wants it
to be.
6 years ago


No comments:
Post a Comment