"the pattern has been losses in the morning to the intraday low and a rally off that low. If that pattern holds, it would make sense to take gains on the gap up and look to re-enter the same longs as the market pulls back to a.m. lows"
The main issue is the market is and has, as suggested above, been strengthening off the a.m. lows, it's to the point in which it's not giving any strong signals that it will pullback once more intraday as that would be the best entry, but on the other hand we don't want to buy at elevated prices, especially if you are thinking of using options AND THE ONLY REASON I MENTION OR USE THEM IS BECAUSE I DON'T THINK THE PROFIT POTENTIAL IS WORTH ALL OF THE WORK AND MARKET RISK. If I saw this as a strong area that would last for a 2-week swing, then I'd feel differently, but the market is stronger than yesterday.
My only solution at this point unless we get a clear pullback signal, would be to use leveraged long ETFs of the major averages, whether 2 or 3 x leveraged, that way the timing issue that options have is not as big of a deal and the draw down if we do get the pullback is not that big of a deal vs. options.
There could be a hybrid trade in which part of it is long equity/ETFs and if the pullback comes, juice the profit potential with some options. By the time I get through this post I may have a signal, but I have to show you all the charts to give you the picture and outlook. The TICK chart is invaluable here.
SPY

It also shows the "Bounce" and puts that in perspective next to the weakness so you should be able to see, whatever price does, however strong it may appear, there's an insane amount of weakness in the market and that must not be forgotten for a moment.


QQQ


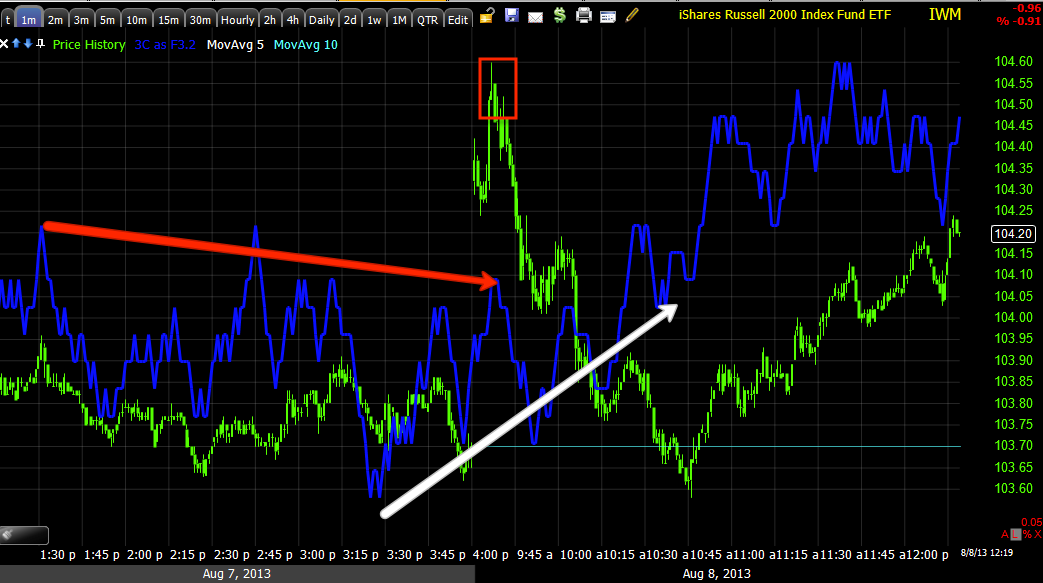
IWM

If you are looking at the big picture here, you'll notice again how weak the last run last week was and even for a decent bounce moving forward, there's very little strength compared to that weakness. If you don't know how to interpret that, I'm not sure I can add much to it. Put bluntly, any market strength in price is almost laughable, yes we can trade it, but if you don't know what to do with that price strength, you shouldn't be trading. I don't say that to insult anyone, I say it because you have an area of distribution right next to an area of accumulation and the difference is STRIKING.

, I include it only so you can see what the 3C signals said, what happened and what happened with underlying flows from smart money.
DIA


No comments:
Post a Comment