This is already a very complex and dangerous market, if you see some of your favorite traders in the Financial media, typically they have a very glum look when asked about the futures of the market because they know the very simple equation of what lifted the market since 2009, where the market would be today with out F_E_D intervention and QE (much lower) and they know that the mechanism that lifted the market is ending. I've heard from many of you as new members that you have been bearish on the markets for the last several years and have been punished for it, there's one simple explanation, QE or Operation Twist, the F_E_D injects 40+ billion of newly printed $USDs in to the banks every month (to one degree or another since late 2008) and the banks look for higher returns by putting it in the market creating a perpetual source of demand, this is why they say, "Don't fight the F_E_D", however that is ending.
Look it up yourself, the "Effects of QE on the stock market", here are just a few examples.
The SPX since 2008 shows the periods of F_E_D intervention, what the market did, the periods when there was no F_E_D intervention and what the market did.
From left to right before any F_E_D or QE intervention the market loses -47%, during QE (Quantitative Easing) One, a +43% gain, when QE 1 ends and before the market knows anything about a new QE called QE2 coming, the market loses -14%, as QE 2 makes its way through the market the SPX gains +26%, in between F_E_D intervention after QE2, the market loses -13% in a VERY short period and then operation Twist lifts the SPX +20%.
Do you see the pattern? QE has done nothing for the economy outside of the Financial system or the stock market, it hasn't done what it was advertised to do, end the crummy economy and drop unemployment rates.
Forgive me, I digress...
The charts this morning and why I believe we will see choppy trade, but I don't think we are done with the move or at least not at the area where I would consider something like a IWM short as a core position, right now they are trading positions and yesterday's IWM puts are already at double digit gains.
IWM as an example (remember we are using multiple timeframe analysis or multiple trend analysis).
intraday 1 min IWM doesn't look good, this is what was expected and the reason IWM Puts were opened yesterday.
IWM 3 min shows a deeper leading negative divergence, this is why I am comfortable with Puts, but am still treating this as a short term trading opportunity, thus the need for leverage (3x leveraged ETFs can work too, like SRTY long for IWM short coverage).
The IWM 5 min is negative, but not so much I'd base a trade off this chart, that leaves me still with a shorter term trade needing leverage.
The 10 min chart hasn't seen a divergence move that far yet, so in my view, unless it does, we are likely to see a choppy area with trades both up and down depending on what the shorter term charts tell us. When these longer charts start to fall apart, then we start looking at core short positions or longer trending trades.
IWM 30 min with the range/accumulation area and distribution in to the upside, this is to be expected, it is the reason for the move, but it's not an imminent threat of a crash in IWM, it's progression of expectation.
The 60 min chart is overall leading negative, but right now it's trading in line based on the accumulation zone creating a "Counter trend rally".
When this chart goes clearly negative, we'll be in longer term core shorts.
The 2 hour chart shows primary 3C negative downtrend, this is where the market is eventually going according to the 3C charts which makes perfect sense.
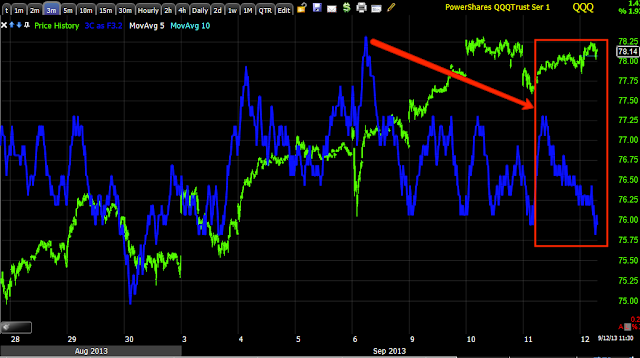
Opening charts for today-QQQ
This 1 min is leading negative, I almost entered a QQQ put or SQQQ long (3x short QQQ), but there was too much correlation with the IWM already short.
QQQ 3 min leading negative, this is what I expect for the type of "Hit and run" options or leveraged ETF trading we are looking at, of course we will let the market tell us when it's time to shift.
The 5 min QQQ is still in line so this tells me that unless it weakens substantially, the highest probabilities are for chop, a day or two up and the same down which can still have a trend of generally up or down, but most traders get eaten alive in such a meat grinder.
SPY 1 min intraday is CLEARLY negative, it should head lower as our IWM put and VXX call represent.
The 3 min chart makes it a move that is worthwhile, but I still think chop is highly probable while longer term distribution takes place which should degrade the longer 15, 30, 60 min 3C charts at which time we are looking to be pretty well loaded up with core short positions although I'd take any position now that is at it's highest probability as that will happen.
I need to track the market, the SPY arbitrage and ANY currency moves that look like they'll effect the market.
Stay patient, but be ready to act quickly.
Is interest rates about to start going up?
-
Yes, I know - it does not make any sense - FED is about to cut
rates...but....real world interest rates are not always what FED wants it
to be.
6 years ago


No comments:
Post a Comment