Yesterday we saw the start of a positive divergence, short term (in fact possible to be undone today or before tomorrow at 2 p.m.
This looks like the last chance bounce before the unknown wild card F_O_M_C risk hits at 2 p.m., that was my gut feeling for the reason for this move. THIS MOVE IS NOT "TAPER-OFF" SENTIMENT IN FRONT OF THE F_O_M_C, if it was the Dollar would be down on this bounce significantly, gold would be up significantly and Treasuries would be up significantly, none are, only the market so I think the reasons put forth yesterday hold water.
As expected, the market on its own doesn't have the power to lift higher, the USD/JPY may have some influence in the future, not too far off, but none of the carry pairs lifted the market either as was my opinion yesterday.
5 min chart of the USD/JPY has some upside, but not nearly enough to even bounce the market as this doesn't look anything like a carry trade on, it just looks like a wiggle.
My feeling yesterday was the only other source that could drive the market higher in absence of real demand
as evidenced by the dismal volume today, was the short term manipulation of the SPY Arbitrage being activated with the 3 assets that control it, (HYG, TLT and VXX).
HYG vs the SPX today is up, just as the SPY Arbitrage would need for manipulation to send the market higher as algos read High Yield Corp. Credit as being bullish and buy stocks.
However in to the move up, 3C is showing obvious distribution in HYG so it doesn't look like anyone wants to hold HY Credit (An institutional risk asset) in front of the F_O_M_C, they just needed to move it up enough to activate the SPY Arbitrage.
VXX (short term VIX Futures) were positive yesterday morning which sent VXX higher and the market down as algos read VXX moving down as a fear among traders and reach for protection of VIX futures, but the move up today is what algos see as that fear of risk being unwound, in combination with HYG, to algos (machines) it looks like a true "Risk on event".
As mentioned though, I thought this would be a short term bounce and the 2 min VXX chart shows no damage at all, so the divergence to move it was very small, it didn't even register on the 2 min chart, again just enough to move it, but no conviction in the move beyond a short term (1-day or so bounce).
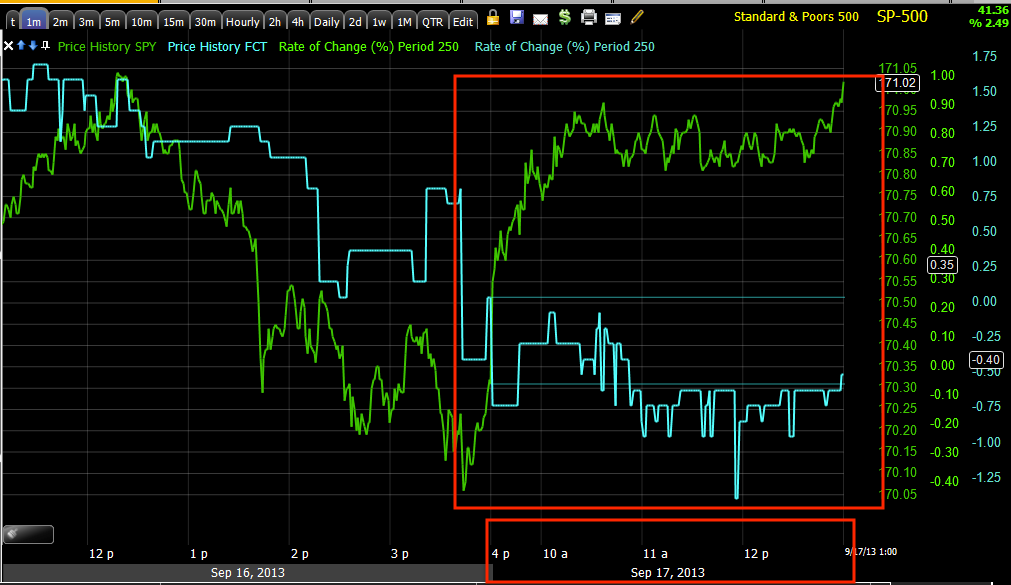
Here VXX in blue moves down and the SPX in green moves up, along with TLT, the third asset in the SPY Arbitrage manipulation, you have the only engine that could bounce the market as there's no real demand, look at volume even with the SPY Arb in the "on" position, it's horrible.
Finally, actual proof of the SPY Arbitrage activated via Capital CONTEXT, this is essentially the only reason the market moved up today which is what was expected yesterday, a weak move with the moves in High Yield Credit telling us much more about the true intentions of the market in a more meaningful way.
As for the averages themselves, they are already starting to see intraday 1 min distribution.
SPY negative on the open Monday and the late day positive divergence I warned about yesterday afternoon,
this is the last of 3 updates during regular hours warning of a bounce brewing yesterday in the late afternoon, there were two earlier updates warning of the same.
As you can see, the same intraday charts today are starting to go negative, this isn't the kind of divergence I'd be taking on a lot of risk with, but it is the information we need to make better informed decisions about assets, trades and timing which is
exceptionally important in front of the F_O_M_C tomorrow at 2 p.m.
REMEMBER, ANYTHING F_O_M_C OR F_E_D RELATED ALMOST ALWAYS SEES AN INITIAL KNEE JERK REACTION THAT CAN LAST AN HOUR OR A FEW DAYS, BUT THAT INITIAL REACTION IS ALMOST ALWAYS WRONG.
*If you look up every F_O_M_C or significant F_E_D event date and check our archives for that day, you'll see I ALWAYS warn of this knee jerk effect because it is such a reliable feature of these situations and can often be faded for a nice trade, while retail only knowns to follow price.
The 3 min SPY shows the accumulation range I had talked about so much in white,
thus was the accumulation NEEDED to send the market higher to breakout stocks like AMZN, PCLN, NFLX and the example of the entire concept, FRP. We didn't arrive to this conclusion after or as it happened, we expected this as the range started weeks ago and that was given as the reason for the move or at the time, the move to come.
QQQ late day 1 min accumulation yesterday as posted 3 times in the afternoon for a bounce, the bounce today is already seeing a range where 3C activity is often highest and a negative divergence already forming there.
Again, my assumption is today was the last day the market could bounce before the uncertainty of the F_O_M_C tomorrow, whether it was to such in retail which it has, to sell accumulated longs from the range at higher prices, to sell short in to higher prices or all 3, I can't say, but I suspect all 3.
As mentioned yesterday, there was NO 3C strength beyond 1 min as this 2 min QQQ chart shows, in fact distribution today is now evident.
IWM 1 min with some positive divergences late last week, distribution on Monday morning's gap up open and again distribution in to today's small bounce higher.
Again, I would not take action on this alone as of yet, but continue observing and waiting for our chance to set the wolf pack lose on the sheep.
As mentioned, we see the Range Accumulation to the far left which we expected to lead us to a strong upside market move, but not for the reasons retail suspects, in fact the opposite of those reasons, to push certain stocks in to breakouts that retail will chase, providing the demand Wall St. needs to sell short at better prices, but more importantly, at significant volume that they need to move positions. Retail is predictable, they chase breakouts so all Wall St. needed to do was set up a move up as there were and are so many stocks in the FRP situation that make for excellent shorts if they can just breakout (a head fake move) so Wall St. can use the demand to sell short in to, it's the exact same trade we took (longs in the range to sell at higher prices and then shorts as stocks move above the breakout area-
See the FRP video for the complete concept).
Again, 3C is showing the distribution we expected to see on a move higher in price.
Professional sentiment is no longer interested in following stocks higher, just as we are largely no longer interested in staying long in this risky area unless we have objective data that says we should.
Institutional sentiment turning sour on the market.
There was a small positive sentiment before the bounce, it has turned negative in to the bounce.
Our second sentiment indicator looks even worse.
Below. yields and why they are such a fantastic leading indicator.
In green on the start of the move up, yields which tend to pull stock prices toward them like a magnet were in line with the start of the rally out of the accumulation range, as we neared what should have been a pullback that was disrupted by the Syrian diplomatic solution, Yields started going negative. Now Yields are clearly dislocated from the SPX especially this week and will be exerting magnetic force on the market for it to follow yields to the downside, this is a great leading indicator.
HOWEVER THE MOST DAMNING EVIDENCE THAT APPEARED LAST WEEK, WAS MUCH WORSE YESTERDAY AND AS I SAID YESTERDAY, IF THIS IS WORSE TOMORROW, WE KNOW THE MARKET IS IN REAL TROUBLE, is the Institutional risk asset of High Yield Credit, HYG is HY credit, but correlated to the market for SPY Arbitrage manipulation so not as reliable short term, HY Credit has no such correlation and moves the way institutional money feel about the market, yesterday was the worst move in months for HY credit vs the SPX, today as I expected and hoped to see, things got much worse, this is also a fantastic leading indicator and right now, one of the most important as it shows what smart money is doing, it matches 3C and they aren't called smart money for nothing.

"A" shows HY Credit positive in the accumulation range and leading the SPX to the upside, then "B" HY credit is in line with the early start of the upside move. At "C" HY Credit starts to dislocate negatively and "D", there's a serious dislocation that I can't recall the last time I saw, maybe right around the Key reversal day in spring?
This is a closer look with yesterday's move lower and as I was hoping to see, today its even worse.
All of this taken together has formed the risk of a large downside move as the CONTEXT model for SPX futures (ES) has now moved to an even deeper dislocation suggesting ES is overvalued by nearly
90 points!
This is definitely the worst reading I've ever seen, about 2x worse than anything I've ever seen. CONTEXT is saying the probabilities of ES (SPX futures) moving down at least -90 points is very high.
This is right in line with our expectations for what happens after the last strong move to the upside coming out of the accumulation range.
It seems our analysis was right on weeks before these moves even started.
Now it's a matter of continuing to confirm and looking for the timing or tactical signals that say, "Load up the truck".


No comments:
Post a Comment