Then the move that would need to occur to even set up the possibility did....
And now the confirmation signals of distribution which would be what would help confirm a false breakout/failed breakout or bull trap are starting to come in.
Also interestingly as I was talking about Icahn and being a smart bully, one of the other smartest guys in the room ironically chimed in about Icahn and AAPL at a very strange time just before Icahn's launch of his site that I presume he intends to use as a more than 140 syllable version of twitter. The other smart guy and seemingly very disconnected as the bond king, none other than Bill Gross from PIMCO?

Really, what the heck is going on? PIMCO is bonds, why would Gross be talking about Icahn and more or less, "Stop bullying them" just before Icahn's AAPL activism site launches?
This should be a very interesting fight, Ackman (they say is smart, although I didn't think so when he proudly declared his HLF short and just invited Icahn in to corner him) is supposedly a smart guy, but he's no Bill Gross and this to me is very unlike Bill Gross, he seems to be a little more humble and classy than to get down in the mud with Icahn and Icahn will fight dirty.
It just seems like there's a lot more than meets they eye and I can't wait for Icahn's retort.
In any case, to more objective analysis...


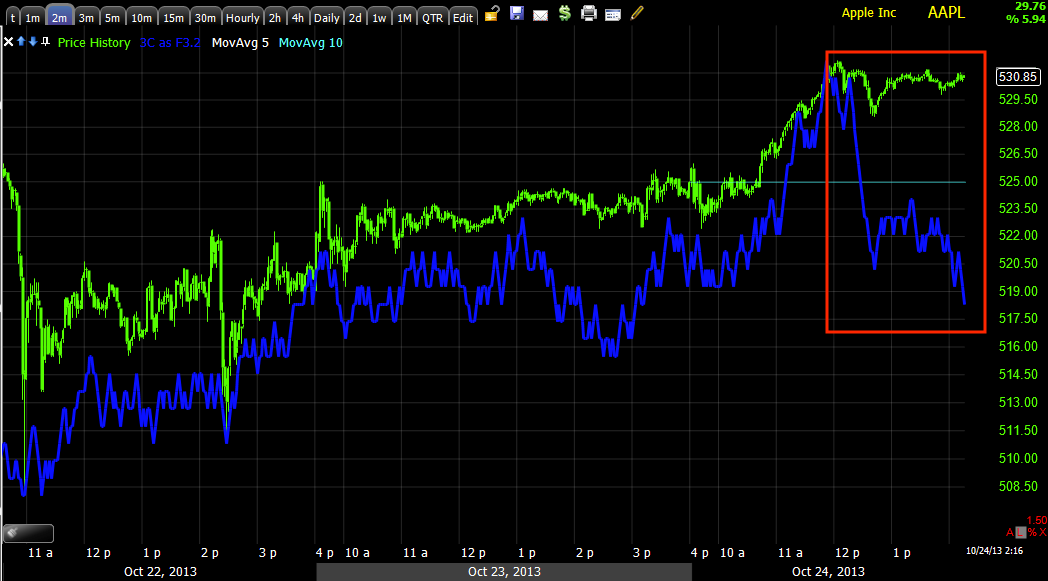


The difficulty still is the 60 min chart.

I'm thinking about AAPL, I'm thinking I'd love to have a core short, but I don't have the charts to support that kind of a position. As a trading position I just don't see this as worth tying up that kind of capital on an equity short which leaves a put position, this is what I'd have to lean toward, you may be able to do something different.
For options, I require a high degree of evidence so while I believe we are seeing distribution on the breakout instead of 3C moving in line and confirming, I'd say this is a bull trap as suspected with that feeble bullish ascending triangle which was one of the first technical price patterns I learned to buy when first learning technical analysis some 15-16 years ago when everyone called it "VOO-DOO analysis" and said there's no way a bunch of lines can tell you anything about a stock, my how times have changed.
That's the info for now, you might put an intraday Rate of Change indicator on price, if you can't attach it directly to price add an invisible 1-bar moving average and add ROC to the 1 bar moving average as it is exactly the same as price.
Also watch for the limit orders to be hit, volume should spike on a new high or a breakout above some level I'm not seeing, perhaps a moving average or a longer term resistance level.
AAPL is still VERY much on my radar, I'm just looking for probabilities to look even better.


No comments:
Post a Comment